
How Hedge Funds Are Positioned - Commitment Of Traders Update
Following futures positions of non-commercials are as of October 13, 2020.
10-year note: Currently net long 75.3k, up 5.7k.
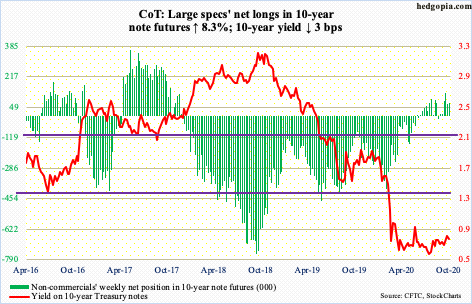
After taking a one-month pause through early July, the Federal Reserve once again is accumulating assets. In the week to Wednesday, they jumped $76.8 billion week-over-week to $7.15 trillion. This is just $17.5 billion from the record $7.17 trillion posted in the week to June 10. After that high, the balance sheet shrank to $6.92 trillion in the next four weeks. From that low, it has now gone up $230.7 billion.
It is worth noting that the central bank’s holdings of Treasury notes and bonds have persistently risen, to this week’s $3.81 trillion. Among others, this continues to act as a roadblock for bond bears (on price). With the US economy as leveraged as it is, the Fed cannot allow interest rates to sustainably rally. The 10-year yield has not been above one percent since March 20th. Rates’ latest attempt to rally stopped at 0.8 percent last Friday, with this week ending at 0.74 percent.
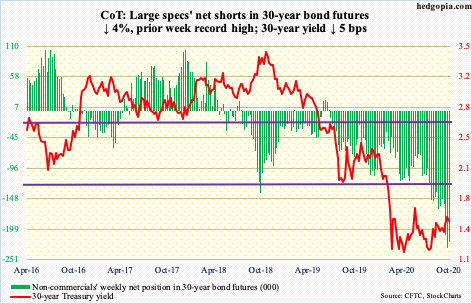
30-year bond: Currently net short 221.1k, down 9.2k.
Major economic releases next week are as follows.
The NAHB housing market index (October) is due out Monday. Homebuilder sentiment shot up five points month-over-month in August to 83 – a new record. Data goes back to January 1985.
Tuesday brings housing starts (September). In August, starts dropped 5.1 percent m/m to a seasonally adjusted annual rate of 1.42 million units. April’s 934,000 was the lowest since February 2015.
Existing home sales (September) are due out Thursday. Sales rose 2.4 percent m/m in August to six million units (SAAR). This is the third m/m increase since bottoming at 3.91 million in May. The median price rose 1.7 percent m/m in August to $310,600 – a new record.
WTI crude oil: Currently net long 528.1k, down 6.1k.
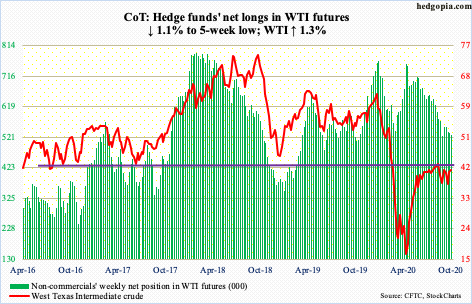
WTI ($41.12/barrel) began the week with Monday’s 2.9-percent drop which stopped right at the 200-day ($38.63); the average is now slightly dropping. This was then followed by the recapturing of the 50-day ($40.74) in subsequent sessions. The 10- and 20-day (respectively at $40.47 and $40.02) lie in between. All these averages lie in so close proximity that the price has been unable to deviate too far away for too long.
For over three months now, rally attempts have been bound by $41-$42, although the crude rose as high as $43.78 intraday on August 28. Bulls would have raised their odds should this level fall.
Thursday, they liked what they saw in the EIA report for the week to October 9 and rallied the crude 0.5 percent, reversing early weakness. US crude production dropped 500,000 barrels per day to 10.5 million b/d. As did crude imports, which fell 446,000 b/d to 5.3 mb/d. Stocks of crude, gasoline and distillates all decreased – down 3.8 million barrels, 1.6 million barrels and 7.2 million barrels respectively at 489.1 million barrels, 225.1 million barrels and 164.6 million barrels. Refinery utilization declined two percentage points to 75.1 percent.
E-mini S&P 500: Currently net long 40.2k, down 33.8k.
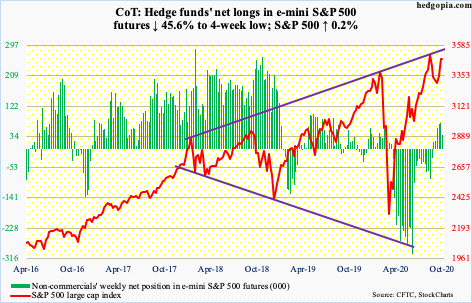
After losing $48 billion in eight consecutive weeks, US-based equity funds took in $2.4 billion in the week to Wednesday (courtesy of Lipper). Bulls obviously hope this is the beginning of a trend. Since hitting a record $4.79 trillion in the week to May 20, $407.1 billion has left US money-market funds (courtesy of ICI). Not a whole lot of this money managed to move into S&P 500-focused ETFs, with SPY (SPDR S&P 500 ETF), VOO (Vanguard S&P 500 ETF) and IVV (iShares Core S&P 500 ETF) collectively gaining $4.6 billion during the period. In the week to Wednesday, these ETFs lost $175 million (courtesy of ETF.com).
Despite this lack of cooperation from flows, the S&P 500 is up substantially the past four months. Among others, foreign buying helped. Until April last year, their 12-month selling of US stocks reached $214.6 billion – a record. By August this year, they were buying $205.1 billion worth, which was the highest 12-month total since July 2007. They were net buyers even during the February-March selloff. This group is worth watching, as historically their purchases – or a lack thereof – have tended to move hand in hand with the S&P 500 (chart here). It is also worth recalling that back then the index peaked in October 2007, before collapsing 58 percent in the next 17 months.
This time around, the S&P 500 peaked on September 2nd at 3588.11, before losing just north of 10 percent in the next three weeks. In the rally that followed, the index rose as high as 3549.85 this Monday. In the subsequent selloff, the 10-day was defended Thursday; the session low 3440.89 came just above the neckline of an inverse head-and-shoulders pattern, which the S&P 500 (3483.81) broke out of last week. With the daily itching to go lower, with a weekly spinning top this week, bulls must hold 3420s.
Amidst this, money managers represented by NAAIM members once again are positioned with a lot of optimism (more on this here).
Euro: Currently net long 168.6k, down 5.7k.
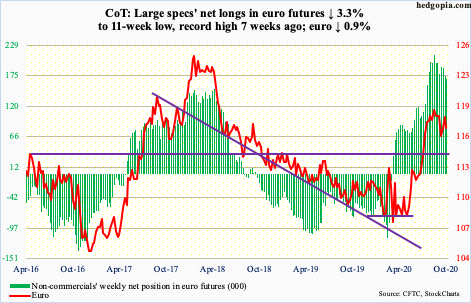
Last Friday’s recapturing of the 50-day was short-lived, with the session high $1.1835 clearly above $1.17-$1.175 as well. Earlier, after losing that level four trading weeks ago, the euro ($1.1717) quickly dropped to $1.1612 by September 25th. Inability to hold above both $1.17-$1.175 and the 50-day once again exposes the currency to that low.
Longer-term, the euro remains overbought on the monthly. It rallied from $1.0635 on March 20th to $1.2011 on September 1st. There is major resistance at $1.19-$1.20, which goes back to May 2003.
Gold: Currently net long 240.7k, down 7.9k.

After having closed last Friday right at $1,920s, gold bugs tried to once again take out this resistance Monday, but to no avail, with the session high $1,939.40 denied just below the 50-day ($1,938). The average is now dropping.
In September 2011, gold ($1,906.40/ounce) retreated after posting $1,923.70. It took nearly nine years before this level was surpassed, which occurred late July this year. The metal then went on to record a new high of $2,089.20 on August 7th. Since that peak, bulls and bears have both been trying hard to reclaim $1,920s.
This is important because gold bottomed at $1,450.90 on March 16th. Billions have moved into IAU (iShares Gold Trust) and GLD (SPDR Gold ETF) since. In the week to Wednesday, IAU took in $176 million; in the last 30 weeks, there was one week of outflows, for a cumulative haul of $8.1 billion. In those 30 weeks, GLD had five weeks of outflows for total gains of $19.9 billion, including $397 million in the week to Wednesday (courtesy of ETF.com). The longer bulls struggle to recapture $1,920s, risks rise that these ETF holders get tempted to lock in gains.
Nasdaq 100 index (mini): Currently net long 17.9k, up 92.9k.
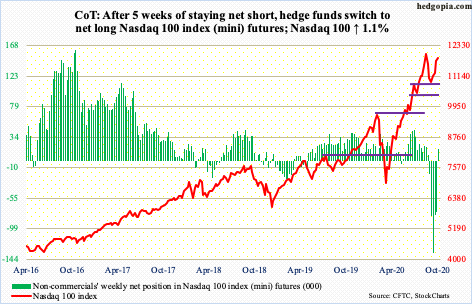
The week began with Monday’s 3.1-percent jump; at the session high, the Nasdaq 100 was merely 1.9 percent from its record high 12439.48 from September 2nd. But bulls were unable to hang on to the gains, although on Thursday bids showed up just above the 10-day (11748.77). In the end, the week ended up one percent, with a wide range of 12204.75 and 11765.49.
The index (11852.17) remains above the neckline of an inverse head-and-shoulders formation, which it broke out of last week. The breakout likely attracted new money. In the week to Wednesday, QQQ (Invesco QQQ Trust) took in $6 billion, which is sizable (courtesy of ETF.com).
It is possible this also led non-commercials to cover. Three weeks ago, they were net short 134,311 contracts in Nasdaq 100 index (mini) futures. This week, they were net long 17,868. In the four sessions through Monday’s high, the index jumped 8.1 percent, which was probably aided by these traders exiting. This potential fuel for squeeze is no more. Nevertheless, Nasdaq short interest remains at a 12-year high (more on this here).
Beginning next week, tech companies begin to report their 3Q earnings. This week, several leading banks and brokers published their results and the stocks were sold on the news. If this pattern holds, tech bulls need to save 11500-11600. A loss yet again opens the door to a test of the 50-day (11465.33).
Russell 2000 mini-index: Currently net long 29.3k, up 3.9k.
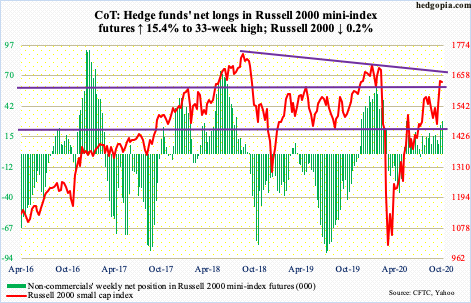
So far, so good. Thursday, small-cap bulls stepped up to defend last week’s breakout (more on this here); at the session low, the Russell 2000 was down 1.4 percent but managed to close up 1.1 percent, to 1638.88. The index closed out the week at 1633.81.
On August 11th, the small cap index retreated after tagging 1603.60 intraday. Since January 2018, bulls and bears have repeatedly fought over control of 1600-plus. Bulls last lost the level late February this year. Last week, they reclaimed it.
In the week to Wednesday, IWM (iShares Russell 2000 ETF) gained $2.2 billion, while IJR (iShares Core S&P Small-Cap ETF) lost $613 million (courtesy of ETF.com). Longs deserve the benefit of the doubt as long as the Russell 2000 is above 1600-plus. Short interest on IWM remains elevated, raising odds of short squeeze.
US Dollar Index: Currently net long 437, up 3.5k.
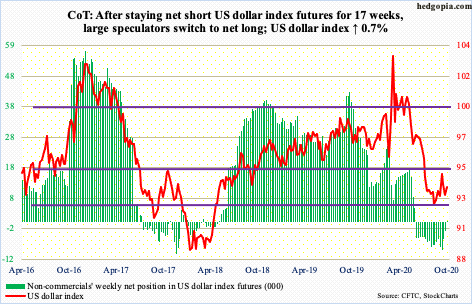
Dollar bears last Friday pushed the US dollar index back below the 50-day (93.34) but were unable to build on it. This week, Monday’s doji session was followed by the reclaiming of the average on Tuesday.
Since late July, the dollar index (93.68) has essentially been rangebound between 92 and 94. Prior to that, it dropped from 103.96 on March 23rd to 91.75 on September 1st. Support at 92 goes back to at least June 2003.
As long as 92 holds, bulls deserve the benefit of the doubt. As things stand, they need to take out 94.79, which was reached intraday on September 25th, to build momentum.
VIX: Currently net short 101.9k, up 8.4k.
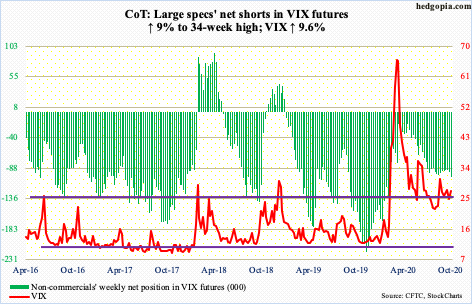
VIX (27.41) refused to close under the 50-day (25.80) both last Friday and this Monday. The problem is that rally attempts keep getting sold. Thursday’s intraday high of 29.06 did not even make it to the 200-day (30.35), which has acted as a roadblock for a month now.
So, the grind continues. For now, a break either way has the potential to dictate near-term momentum. From volatility bulls’ perspective, the good thing is that support at mid-20s has held. On the daily, there is room for volatility to perk up.
Disclaimer: This article is not intended to be, nor shall it be construed as, investment advice. Neither the information nor any opinion expressed here constitutes an offer to buy or sell any ...
more

