
How Do Cash Holdings Turn Into Equity Holdings?
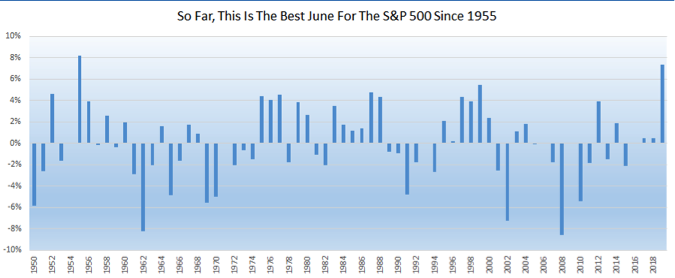
For the year, the S&P 500 is up nearly 18% and the month of June is proving to be the best June on record since 1955. For June alone, the benchmark index is up 7.7 percent.
It took the S&P 500 just 13 trading days to go from closing below its 200-day moving average to setting a new all-time high. Rather remarkable even if it wasn’t the first ever occurrence. Just in the past 20 years, these were faster: (OddStats)
- July ’16 – 9d
- Oct ’14 – 10d
- Mar ’00 -5d
One other fun fact you might be interested in with regards to the S&P 500’s performance and history.
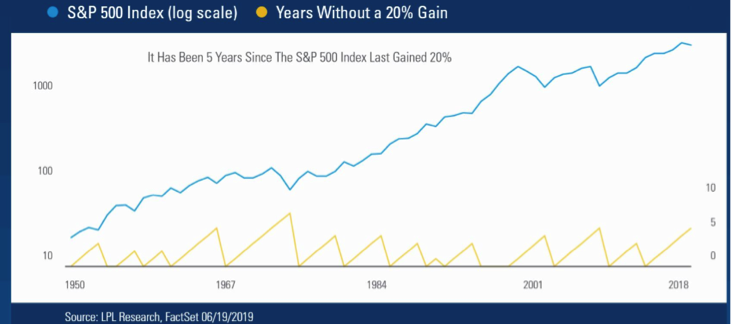
As shown in the chart above from LPL Senior Market Strategist Ryan Detrick, it is interesting that the S&P 500 hasn’t gained more than 20% in any one year for 5 consecutive years. “Only once since 1950 did it go more than 5 years in a row without gaining 20%, thus if this pattern continues we very well might get to 20% in 2019.”
In determining whether or not the June rally is a “healthy” rally we can look at just how many sector ETFs are trading above their 50-day moving average. Most every ETF is trading above their 50-day moving average shy of the energy sector, which has been hindered by the slide in crude oil prices. This past week, however, crude oil jumped as Iran/U.S. tensions elevated with Iran shooting down a U.S. drone.
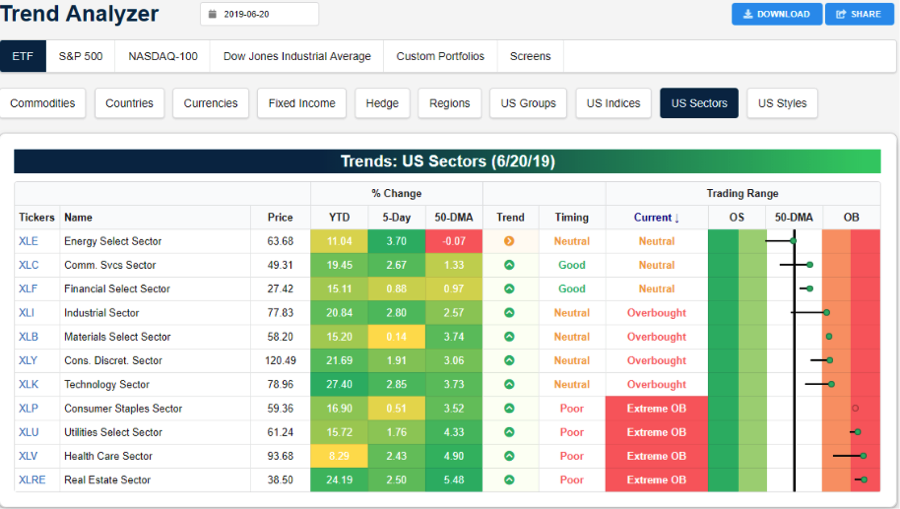
What is also apparent from looking at the Bespoke Investment Group Trend Analyzer depicted above is that defensive sectors are leading the market higher. All defensive sectors are expressing extreme overbought conditions presently while the cyclical sectors and industrials are lagging, but remain over their 50-day moving average. (Finom Group, for whom I am employed, had suggested buying shares of XLV at $85.78 more than a month ago to Premium members. Since that time it has appreciated 10 percent. I anticipate selling the position in the coming week).
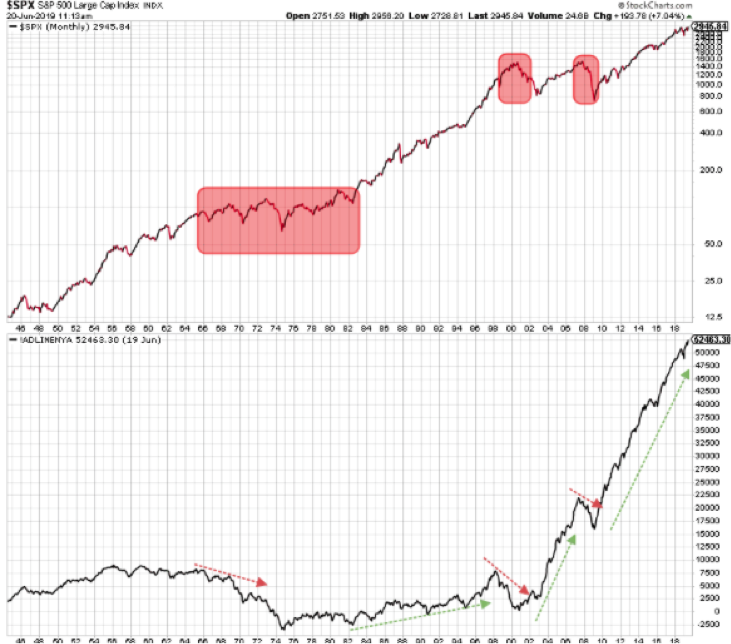
In addition to sector ETFs signaling the June rally to be a healthy rally, the NYSE A/D line continued to hit new all-time highs this past week (bottom chart). Remember, historically the NYSE A/D line peaks out well ahead of the S&P 500 price (top chart). It was making new highs last week and has continued to make new highs. Simply put, with the NYSE A/D line continuing to march higher, there doesn’t appear to be any technical warnings for the market presently.
If we are to layer onto the rally a neutral reading of 57 for the S&P 500 14-day RSI, we would suggest more gains are in store for the S&P 500, even if not right away. One of the issues that may prove to cause a headwind for the S&P 500 and peer indices near-term is the onset of earnings season that is anticipated to show Q2 earnings declined on a YoY basis. In addition to an earnings headwind, Friday’s quad-witching day tends to highlight structural adjustments to the major indices that plagues the following week’s performance.
As shown in the chart below from Bloomberg TV, the week after a quad-witching Friday the major indices are usually found to decline. The declines aren’t terribly significant, but in 25 out of the last 29 years, all three major averages have declined after a quad-witching day. The reason for the declines is that demand diminishes in the options pit.
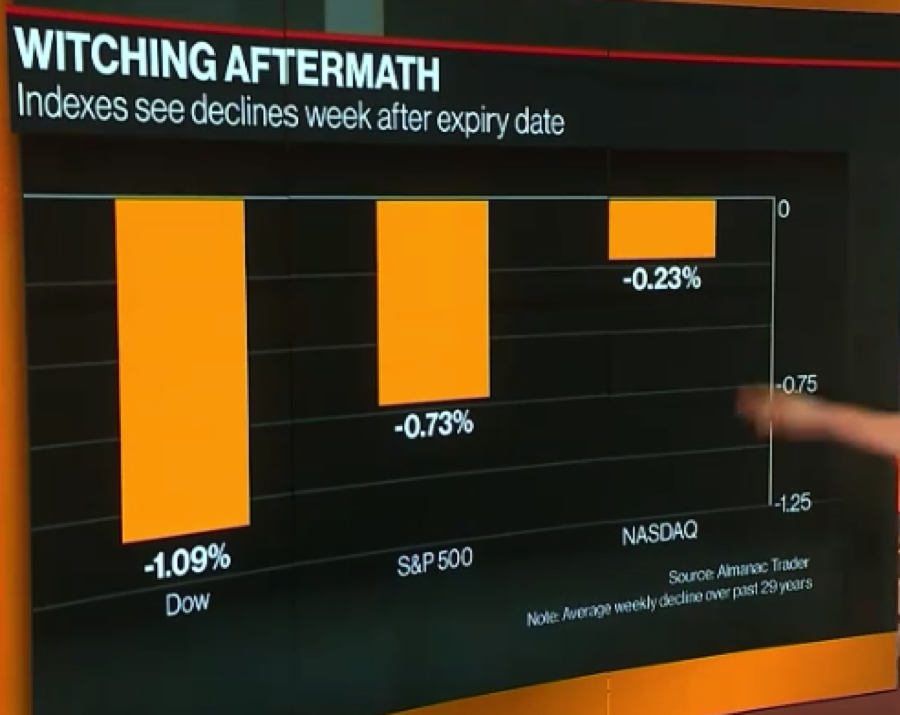
Given the statistics around a quad-witching Friday, investors shouldn’t be surprised if the markets do in fact give up some of their YTD gains and after closing the week near all-time highs. I mean if you don’t believe in “option pinning” folks, then maybe you think the SPX closing at 2,950 means nothing?
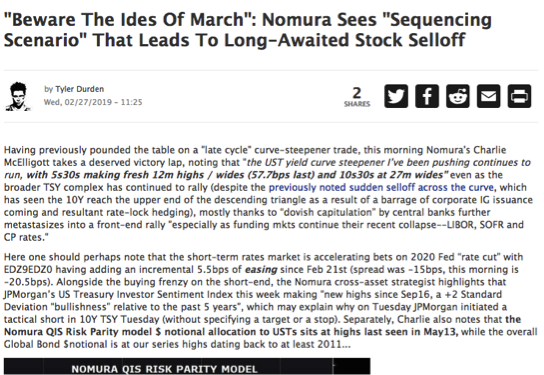
With the aforementioned in front of mind for the coming week, Nomura’s Charlie McElligott offers a possible scenario. He sees the S&P 500 sliding next week only to spike even higher, predicting that near-term moves may head-fake sentiment in the coming days. “It is worth noting that there is a ‘sequencing risk’ set-up with this week’s trade into next week and thereafter which could head-fake sentiment”:
- Witness this type of “force-in grab” into Stocks on account of the powerfully dovish CB moves this week, on top of the remarkable Equities “under-positioning” I’ve been highlighting the past few months
- This then corresponds with the already VERY bullish analog/seasonality for SPX into the June serial Op-Ex (tomorrow), as options overwriters roll their in-the-money calls out and thus create big notional Delta to buy
- But then dangerous the week AFTER Op-Ex (next week), you lose this overwriter “Delta buying” impulse (1w after June Op-Ex SPX perf -1.4% median and 87% of time LOWER, contingent on rallying the 1m into Op-Ex) and 37% of the Gamma expires tomorrow ($4.2 of the $9.4B at this monster 2950 SPX strike)
- Additionally you then too see the downgrade to the corporate buyback “bid,” as we are now deeply embedded within the “Buyback Blackout” window (over 75% of SPX companies within their blackout now)
- The market then risks “mis-reads” this potential FLOW-CENTRIC weakness in Equities next week as some sort of “fading the Fed”—when in fact it’s almost entirely mechanical in nature
- This type of head-fake could, in fact, see more shorts added and sentiment purge, which then perversely is the fodder for a melt-up into SPX 3000s
We’ll have to wait and see if any near-term equity market and sentiment damage takes place. Let’s face it; sentiment isn’t all that bullish presently anyways. Moreover, recent analysis and forecasting from McElligott hasn’t born fruit as Finom Group has chronicled. Remember McElligott’s failed “Ides of March” market sell-off thesis?
The most near-term risk to the market rally is the G-20 Summit meeting between President Trump and President Xi. To reiterate, I believe the base case scenario is a trade truce that includes:
- Agreement that no additional tariffs will be levied by either country
- Timeline is set in place to remove certain restrictions placed on Huawei’s business operations with regards to U.S. suppliers and buyers.
- Additional timeline for monitoring improvements made by China with regards to intellectual property theft
- Agreement to increase commodity purchases from the U.S. by China
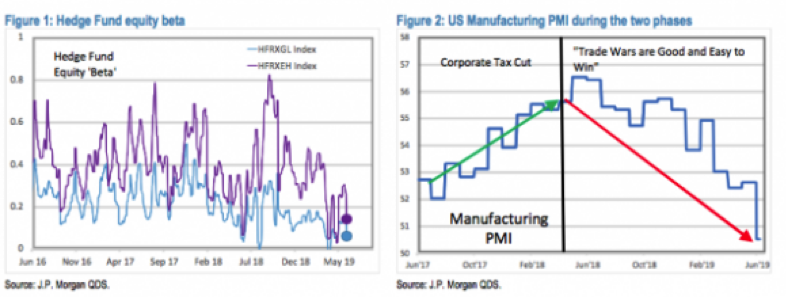
Since the trade war began, it has loomed large over the equity markets. Figure 2 shows the U.S. manufacturing PMI rising during the first phase, and then steadily dropping during the ‘trade war’ phase. With the recent escalation of the trade war, the decline in manufacturing PMI accelerated and could enter contraction territory unless there is progress on trade. We see a similar impact in equity markets. Before the trade war, equity markets were rising at an above-trend pace and then stayed unchanged for ~18 months. If one takes that the average annual return of US equities was ~7% (current capitalization of ~$30T), the estimated cost of the trade war so far is about ~$3T. This may be a conservative estimate as many market segments benefited from flight to safety and declining yields, and without the temporary rally in “safe havens,” the market would likely trade lower. The market damage is ~100 times the tariffs collected, so it is clearly not making the country richer. The impact of the trade war was particularly negative on segments that were its intended beneficiaries, such as manufacturing (autos, electrical equipment, etc.), smaller domestic companies, steel industry, etc. (JPM)
In reviewing all that has occurred during the month of June, which has not concluded as of yet, we can’t help but look forward to the G-20 Summit, which can either prove to propel market multiple expansion or curtail valuations. The Fed has done its job of signaling it is prepared to cut rates in the near future should its inflation mandate and economic conditions continue to weaken. Now it is up to the two global superpowers to find levity in trade talks.

“We see Trump’s phone call to Xi as a small blink in the trade war,” said Allan von Mehren, chief analyst at Danske Bank, in a note. “It reveals that he is keen on meeting with Xi at the G-20, which China had not confirmed before the call. We now see a higher than 50% probability that the meeting will end with a cease-fire and resumption of trade talks.
China will likely stand firm on its demands, including its call for the U.S. roll back tariffs to pre-trade-war levels. Xi may also condition new talks on a withdrawal of the export ban on Huawei, which is a sharp attack on Chinese technology and seen as an attempt to contain China.”
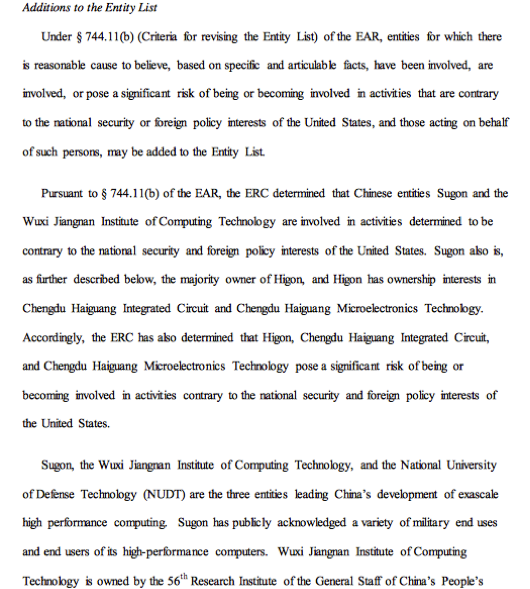
If Trump refuses to withdraw the export ban, China could retaliate by placing U.S. companies on its “unreliable foreign entities list,” he said. Of course with this looming issue the U.S. Commerce Dept. has already increased the number of Chinese companies on its Entity list.
The month of June has been a month of binary risks for each passing week. This is no better represented than in what has been leading the market higher, defensive sectors. As such we’ve seen the VIX prove rather stagnant, not breaking down altogether while the S&P 500 achieves new all-time highs. Investors have been hedging constantly and consistently. Don’t get me wrong; yes the VIX dropped below 14 ever so briefly on Thursday, but even with the market rising greater than 2% this past week, the VIX was up almost 1 percent. That’s called binary risk fear folks.
Even with a more constant VIX performance over the last week and with the VIX up more than 3% over the last month, we had seen noncommercial short VIX Futures positions curtailed. The tide may be turning, however, with COT reporting that noncommercial net short VIX Futures positions rose by some 17,500 contracts this past week.
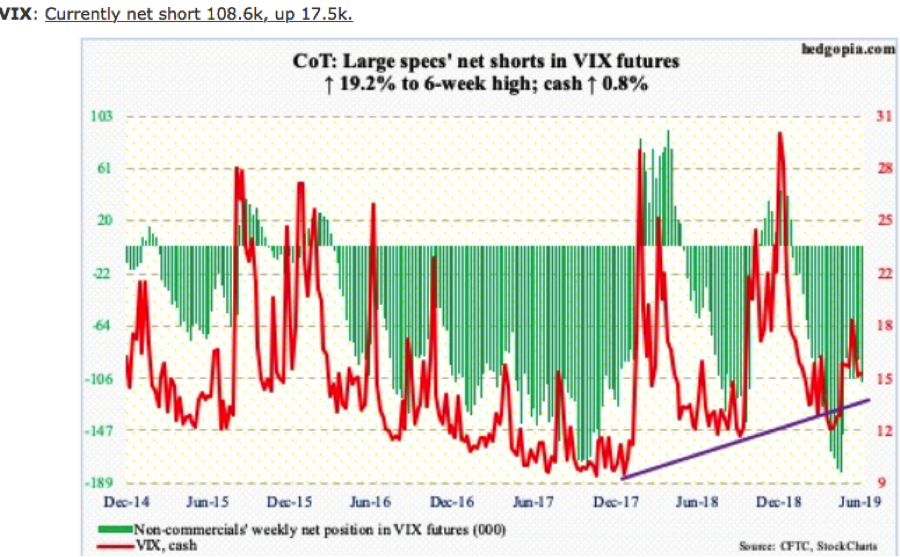
This does not mean the VIX has a greater probability of falling this coming week, but over the course of the July and August VIX Futures cycle, that’s the growing positioning/bet.
Another issue plaguing investors with regards to the push higher in the S&P 500 while the VIX has remained stoic is the fact that both bonds and gold have been rallying. Seriously, the S&P 500, bonds and gold all rallying at the same time and you wonder why hedging activity has been constant? Is the occurrence something to worry about?
The occurrence mentioned hasn’t taken place a whole lot throughout history, but here’s what happens next to the S&P 500 when the S&P 500, gold, and bonds all hit 6-month highs together. (Chart from Bullmarkets.co)
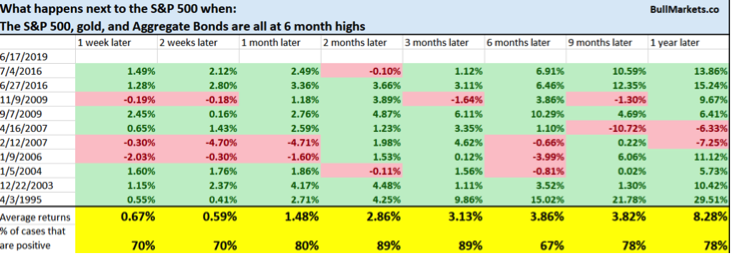
If you were worried that a flight to safety in gold and bonds was a prelude to a market crash, history suggests otherwise. While the next few weeks can be hit or miss in the market, longer-term gains are more often the outcome for the S&P 500.
Heading into another market week with the VIX rising last week, we naturally see the market pricing in more risk. In the week that was, the S&P 500 weekly expected move was $41/points. For the coming week, the weekly expected move is right around $45/points. Keep in mind that we have breached the weekly expected move in each of the past 2 trading weeks, indicating the market has not been efficient at pricing risk.
Weekly Economic Data
If the week has any manufacturing data it is likely to prove a poor economic data week. That’s exactly what we saw in the past trading week as the Empire State and Philly Fed manufacturing Indexes both plunged.
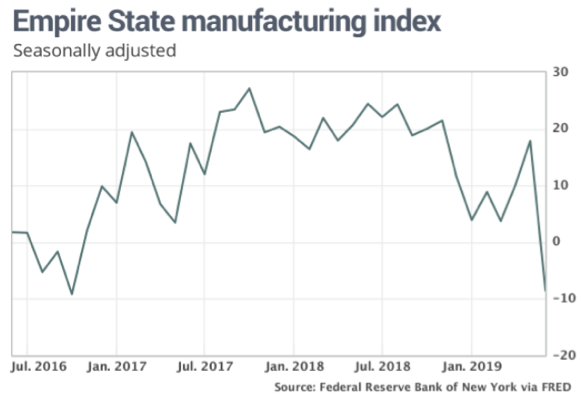
With the Empire State manufacturing index plunging into negative territory, the Philly Fed index barely sustained itself in positive territory. The Philadelphia Fed manufacturing index in June fell to just 0.3 after registering a four-month high of 16.6 in the prior month. Even thought the index found its lowest level since February, there was a bright spot in the report as the future activity outlook ticked higher.
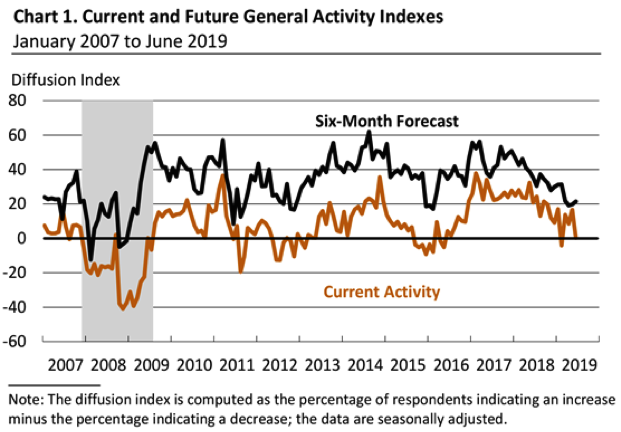
The diffusion index for future general activity increased 2 points from its May reading but remains well below readings of the last few years (see Chart 1). Nearly 40 percent of the firms expect increases in activity over the next six months, while 19 percent expect declines. The future shipments and new orders indexes also improved: The future shipments index increased 13 points, while the future new orders index increased 10 points. The firms remained optimistic overall about hiring over the next six months: The future employment index was virtually unchanged at 27.0, with over 35 percent of the firms expecting higher employment over the next six months.
Beyond manufacturing data, the housing data delivered this past week continued to support my outlook on the housing sector. Total housing starts in May were above expectations, and starts for March and April were revised up. The housing starts report showed starts were down 0.9% in May compared to April, and starts were down 4.7% year-over-year compared to May 2018. Single-family starts were down 12.5% year-over-year, and multi-family starts were up 13.8 percent.
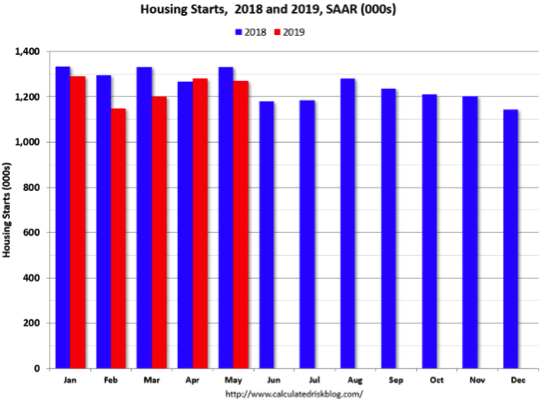
According to housing sector economists and Business Insider contributor Bill McBride, the outlook for Housing Starts is improving.
“My guess was starts would be down slightly year-over-year in 2019 compared to 2018, but nothing like the YoY declines we saw in February and March. Now it looks like starts might be up slightly in 2019 compared to 2018.”
In addition to the better than expected growth in Housing Starts, Existing Home sales also surprised to the upside, as the housing sector continues to gain momentum with lower mortgage rates. Existing-home sales were at a 5.34 million seasonally adjusted annual pace in May, the National Association of Realtors said Friday. Sales of previously-owned homes were 2.5% higher than in April, but 1.1% lower than the selling pace a year ago.
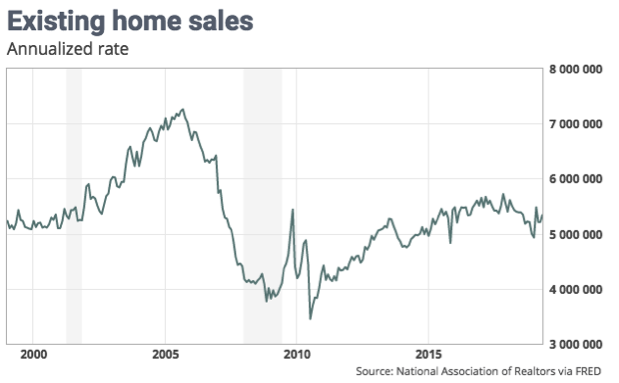
Existing Home sales beat economists’ estimates rather handily and surprisingly, as they had been lagging both Pending Home and New Home sales recoveries. Inventory levels have fallen back below 6.5 months of supply, which when coupled with the 30-year fixed rate mortgage falling below 3.85% recently could find the rally in home sales continuing through the summer months. Here is how one top housing sector economist, Logan Mohtashami, characterized the latest housing sector data:
“Everything looks beautiful to me. I have to remind my readers that housing is always plagued by two houses that either over hype short-term data to up and downside. We either have super housing bulls or bears, but the actual game was in the middle, which I know isn’t sexy to report.
The reality is that 2019 is already going to be another good year as long as you maintain a realistic approach to demand. Purchase application data is at cycle highs, but the rate of growth during the heat months year over year was only trending at 3.7%.”
In parsing the weekly data from the week that was, including the flat Leading Economic Indicators (LEI) data, we’re forced to recognize that much of the weakened data could be attached directly to the threat of tariffs on Mexico in the month of May. Such a threat of great economic consequence halted much of the manufacturing activity and weakened business confidence and the stock market, which fell some 7% in May before finding support. With this threat removed, as an agreement came to pass, I would anticipate a rebound in manufacturing data when these respective indexes cycle around next month. Furthermore, an unfavorable outcome from the G-20 Summit meeting poses a risk to this expectation.
With the FOMC meeting out of the way, investors will be increasingly focused on Fed speeches near-term and there are a plethora of them on the docket for the coming week.
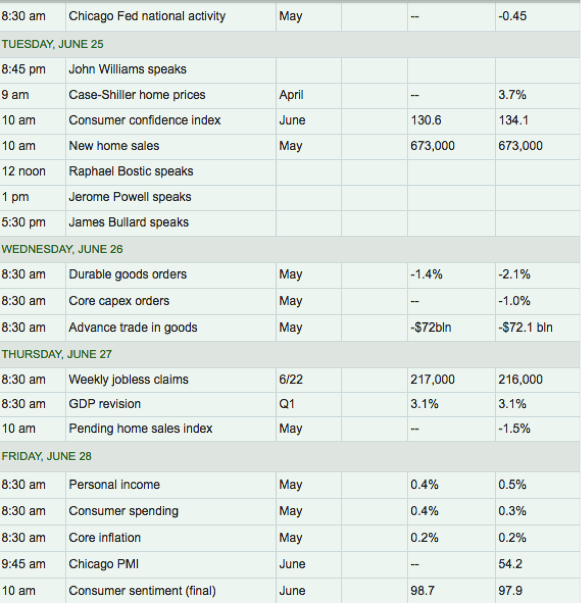
Highlighting the Fed speeches next week will be John Williams, Raphael Bostic and the Fed Chairman himself, Jerome Powell. Investors will be paying close attention to Fed speeches for language around the probability of a rate cut for the month of July. Fed Fund Futures are currently baking in a 100% chance of a rate cut in July, which poses a risk to the market should the Fed not deliver.
The Fed signaling a rate cut predicated on inflation remaining below its 2% target mandate and weakening economic conditions is supported in much of the inflation data and modestly in the economic data. The Fed will get another look at Personal Consumption and Expenditures (PCE); it’s preferred a measure of inflation, on Friday. While consumer spending is expected to remain steady, core inflation may provide just the right amount of weakness to support a rate cut in July. Finom Group remains of the opinion that a cut will take place in July, but the unknown is how much of a rate cut, 25 or 50 bps.
Fund Flows Update
Let’s premise the discussion on fund flows to suggest it can very much be a contrarian indicator.
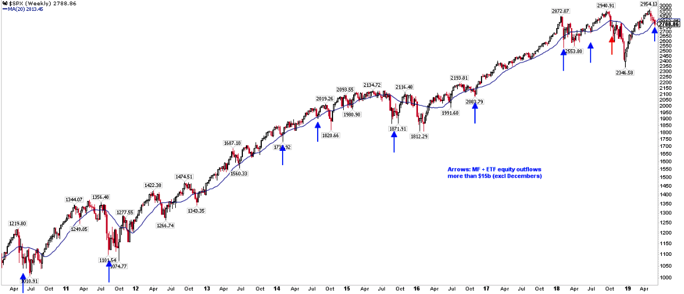
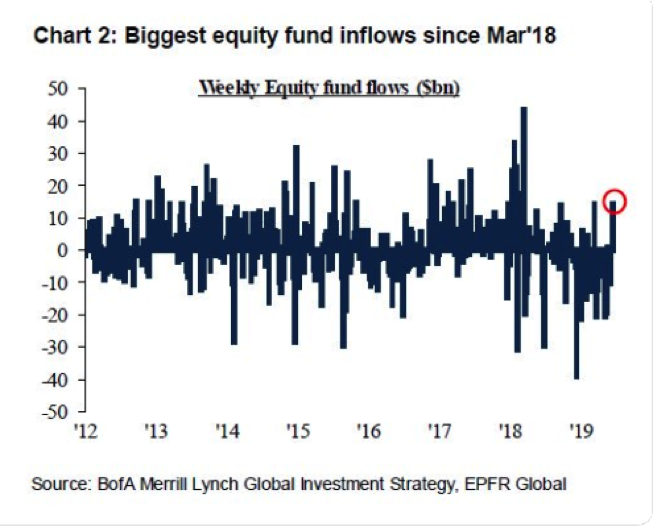
Massive outflows (>$15b) have been followed by rallies of 4% or more, even if the S&P 500 subsequently fell over again (e.g., 2010, 2011, 2014, 2015, 2018). Oct 2018 (red arrow) has so far been the only exception and this was ahead of a very illiquid period in the market where the Fed was tightening into a November-hedge fund redemption period. But we digress
In the previous week, fund flows were strong into equity ETFs. In fact, they were the best since March of 2018.
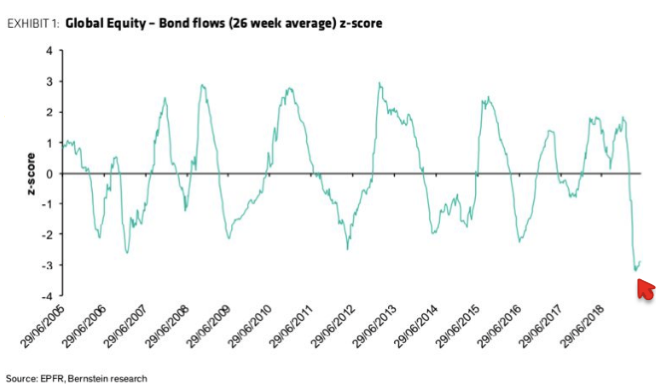
While last week was strong for inflows a study from Bernstein shows that flows out of equities and into bonds, so far in 2019, is the most extreme in more than 15 years.
A similar view from Deutsche Bank on equity outflows – the largest on record – tells the same tale. Equities rose over 20% in the year following similar outflows in 2011 and 2016. Remember from earlier how we mentioned the S&P 500 has gone without a 20% up year for 5 years now?

This past week’s Bank of America Merrill Lynch (BAML) survey of global fund managers is consistent with the data presented above. These managers oversee a combined $600b in assets. Relative to history, fund managers are extremely overweight cash and extremely underweight equities.
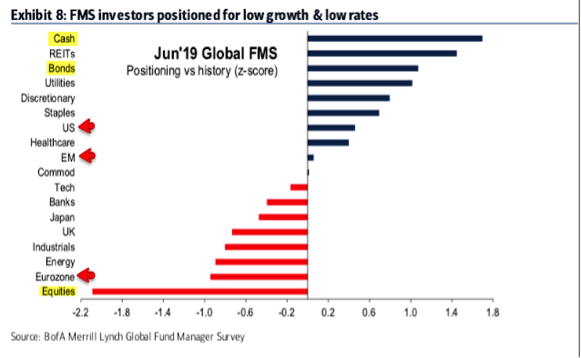
When considering where the probability of a continuation of the 2019 equity market would come from, it’s clear there is a great deal of cash on the sidelines that investors can put to work should the earnings and earnings outlook improve. Fund managers’ cash balance is extremely high at 5.6%, a big jump from 4.6% last month. BAML considers cash levels above 4.5% to be a contrarian buy for equities, and below 3.5% to be a contrarian sell.
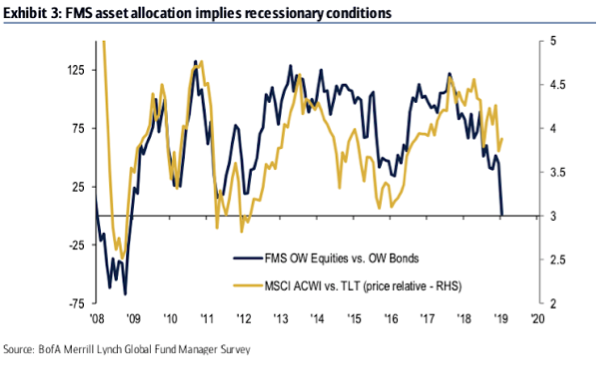
Equity allocations relative to bonds is likewise at an extreme not seen since the end of the bear market in 2009. It’s clear that fund managers have sold equities for the safety of bonds and more recently gold. This is consistent with the fund flow data presented through much of 2019 as bonds have continued to outperform.
And why have investors piled into bonds? There are two reasons, firstly inflation expectations have plummeted and secondly investors are none too keen on the corporate profit outlook for 2019. Having said that, negative profit expectations marked equity lows in mid-2010, late-2011, mid-2012, early 2016 and January 2019, and earlier in 1998 and 2006. Like cash, it’s true that profit expectations were even lower during the 2001 and 2008 bear markets.

My last point of emphasis when it comes to fund flows is with respect to the U.S. Dollar. The U.S. Dollar is considered the most overvalued in the history of the BAML survey (+2.1 standard deviations above its long term mean).
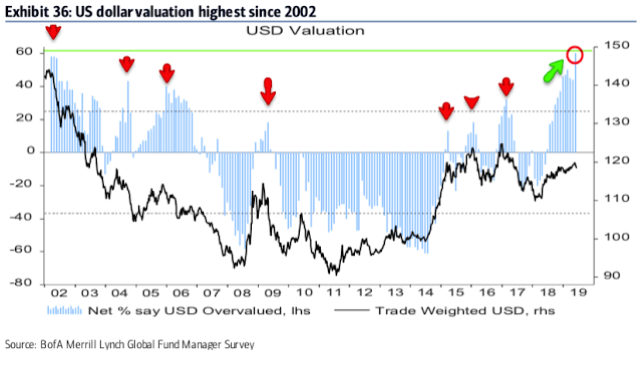
Since 2004, fund managers surveyed by BAML have been good at determining when the dollar is overvalued (red arrows); the last year has been an exception (green arrow). Risk is to the downside. A weaker dollar benefits US multi-nationals as well as European and emerging markets equities.
With the FOMC suggesting the possibility of a rate cut near-term, the USD weakened mightily Thursday and Friday. In fact, the USD/DXY fell below its 200-DMA on Friday to close at the lows of the week.
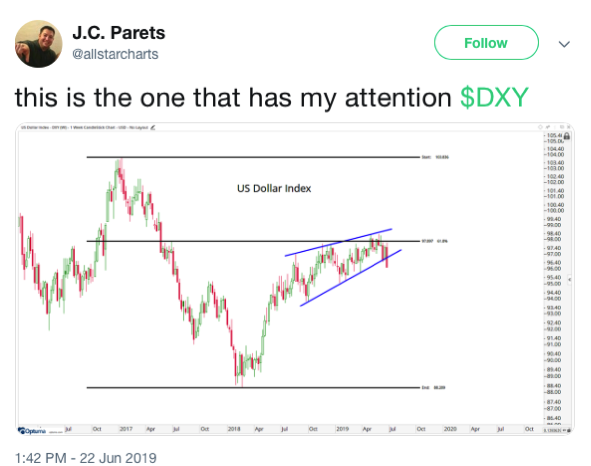
“The last time the USD broke down through the 200-day moving average was in March and it quickly rebounded to the upside. A confirmed breakdown here completes the transition to downtrend and points to 94.50-95.00, said David Keller President at Sierra Alpha Research, Senior Technical Analyst .”
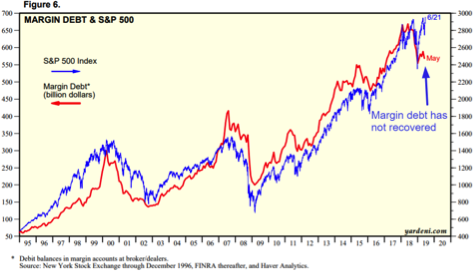
Moreover, it’s not just that fund flows have been a contrarian indicator for the YTD equity market rally as we had previously alluded to; it’s come without the usual margin debt expansion. Margin debt tends to increase along with the stock market. However, margin debt has not really recovered from its 2018 downward slope, even though the stock market has. This is pretty unusual, as shown in the following chart.
Q2 Earnings Outlook
As I have been expecting, the Q2 2019 earnings forecasts would be deteriorating at the onset of earnings season. Last week, FactSet forecast Q2 earnings to decline -2.5 percent. Now the firm forecasts a slightly worse outlook at -2.6% with revenues forecast to grow 3.9% in Q2 2019, which would be the lowest revenue growth for the index since Q3 2016 (2.7%).
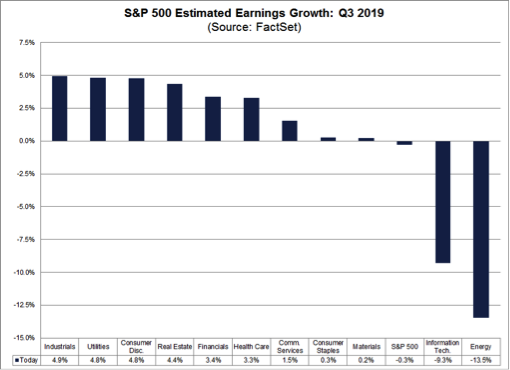
Over the past two weeks, the aggregate earnings growth rate for Q3 2019 changed from slight YoY earnings growth on June 7 (+0.2%) to a slight YoY earnings decline today (-0.3%).
Lipper/Refinitiv has a starkly different outlook for Q2 earnings presently and when compared to FactSet. The firm also has a far better track record than FactSet when it comes to its forecast. The estimated earnings growth rate for the S&P 500 for 19Q2 is 0.2%. If the energy sector is excluded, the growth rate improves to 0.3%. The S&P 500 expects to see share-weighted earnings of $333.2B in 19Q2, compared to share-weighted earnings of $332.5B (based on the year-ago earnings of the current 505 constituents) in 18Q2.
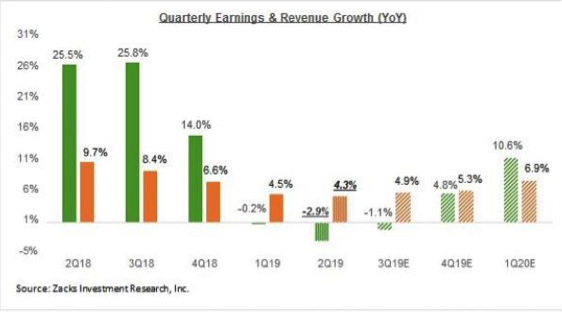
Last but not least, Zach’s Research estimates find the largest earnings decline for the Q2 2019 period. For Q2, total earnings for the S&P 500 index will decline -2.9% from the same period last year on +4.3% higher revenues, with 9 of the 16 Zack’s sectors expected to have negative earnings growth, including the Tech sector.
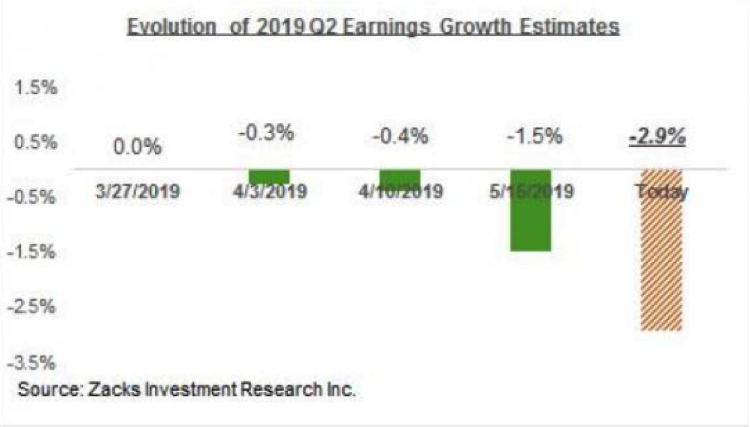
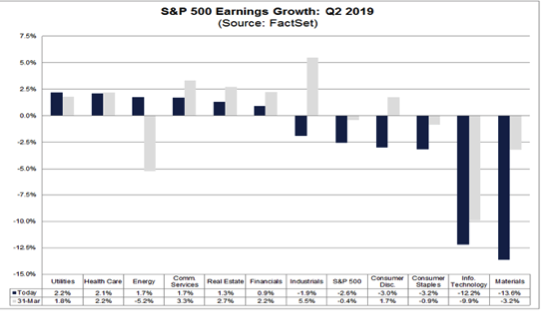
The overall tone and substance of management guidance during the last earnings season was on the negative side. This reflected a combination of slowing economic growth, particularly beyond the U.S., and rising input expenses. As a result, analysts steadily lowered their estimates for 2019 Q2, as you can see in the chart below.
The chart below shows the earnings and revenue growth picture for the S&P 500 index for Q2, contrasted with what was actually reported in the preceding 4 quarters and what is expected in the following 4 periods.
Investor Takeaways
The reality is that I could easily outline many reasons to lock-in some profits come Monday, but with respect to long-term investing, I believe a mid-year pause sets the market up well for the fall and Q4 periods. As such, investors might consider simply hedging portfolio positions in the interim. Nonetheless, the latest notes from Adam Crisafulli, Market Intel at J.P. Morgan Chase offers several reasons to lock-in profits:
Reasons to fade this rally:
1) Investors had already been anticipating expanded monetary accommodation for a while and thus Draghi (6/18) and the FOMC (6/19) were really simply aligning themselves w/market expectations
2) The Fed has some capacity to ease but most of the world’s other central banks are already at (or near) the zero bound and thus the global monetary toolkit is materially reduced (and the bar to resume balance sheet expansion is likely high in both Europe and the US)
3) Trade tensions are still material and companies seem to be behaving as if they will stay a constant overhang until at least the end of Trump’s term (companies are shifting production away from high-risk countries like China)
4) It seems very unlikely the US and China are about to achieve an imminent “deal” and the best that can be hoped for is avoidance of incremental tariffs (and that is not guaranteed)
5) The global growth landscape is exhibiting signs of softness, including in the heretofore area of strength, the US
6) Earnings red flags are appearing with increased frequency, pointing to a downbeat CQ2 season (which formally kicks off Mon 7/15)
7) Valuations are growing elevated as the SPX climbs and the 2020 EPS consensus bleeds lower (the PE is approaching 17x).
As we’ve analyzed the low level of equity market exposure and high cash positions coming from the CTA and VOL-targeting communities of investors, the lack of a near-term recession begs of cash to be put to work in the near future. This is highly dependent on the future outlook of earnings of course, but there also seems enough economic stimulus in the system going forward to support earnings growth in the near future as well.
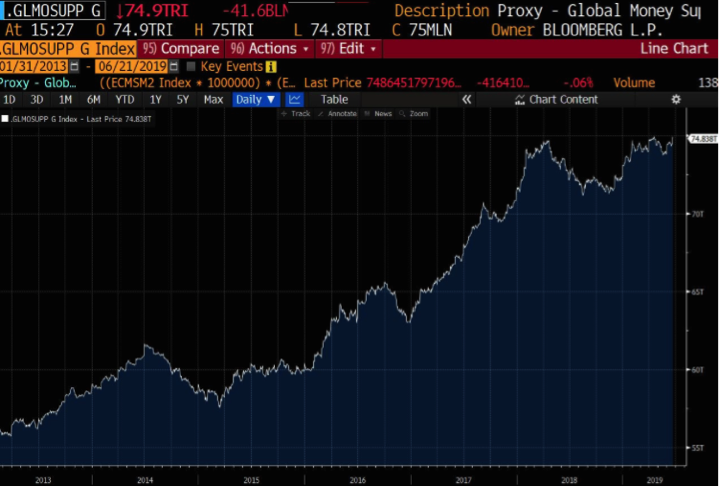
The first stimulus financial condition comes from the downward shift in the yield curve. This is different from the yield curve inversion because it makes investment funding cheaper across the board. An increase in the money supply accompanies the downward shift in the yield curve. (global money supply chart)
Coupling these 2 factors with the decline in commodity prices and increased government spending as major components of economic stimulus in the pipeline and you’ve got a potent mix of stimulus. Stimulus like this takes about six to eight months to filter through the economy. So the timing here suggests an improvement in economic data by August or September.
“Current widespread worries about recession risk, weak economic growth, and disappointing earnings results could ease substantially by late summer or early fall,” says James Paulsen of the Leuthold Group.”
When money begins flowing back into equities and out of cash; this is how strong market moves become exacerbated market moves and lead to the S&P 500 rising 20%+ in any given year also.
Naturally, the coming week is going to be about the anticipation of the G-20 Summit meeting between Trump and Xi. Will they or won’t they find a truce? I believes tensions will ease after the meeting, but also remains cautiously positioned in case disappointment is found in the outcome. Morgan Stanley is pretty sanguine on the G-20 meeting as outlined in their following notes:
Ahead of the much-anticipated G20 next week, MS US policy strategist Michael Zezas has laid out 3 paths and associated outcomes across asset classes:
1) Working towards a deal, delays economics risks
2) Uncertain pause, which helps near term but later, disappoints
3) Escalation (further tariffs) which leads to growth decline and recession.
In outcome #1, which appears more likely following headlines this week, the MS Equity Strategy & Economics teams would expect SPX to trade toward 3,000 before retreating back towards 2,750 as domestic issues weigh on the market.
In the worst case, the team believes SPX could trade toward the team’s bear case of 2,400, and potentially Dec lows, as trade escalation would add to the mounting earnings risk
Goldman Sachs is also downplaying the G-20 Summit meeting it seems. Their notes are as follows:
1. While the meeting between Presidents Trump and Xi at the G20 meeting will clearly be an important event for financial markets, it seems unlikely to be decisive, as the odds of a formal detailed agreement at the meeting seem very low but further tariff escalation would probably not be announced right away either.
2. Our expectation for the G20 meeting is that both sides will commit to re-engage to reach an eventual agreement. This would likely involve a commitment by the US to temporarily refrain from increasing tariffs.
3. That said, we do not believe that the Trump Administration is done raising tariffs. Financial markets have been resilient despite increasing trade tensions. Monetary policy looks likely to become more accommodative in part due to trade policy uncertainty. The President’s stated desire for easier monetary policy might even motivate the White House to increase and/or prolong uncertainty.
4. While we think some additional tariff escalation is more likely than not, we do not expect the White House to impose a 25% tariff on all remaining imports from China. A lower rate, like 10%, would be the natural alternative and would reduce the impact on consumers.
5. Despite the potential for further disruptions over the next several months, we believe there is still a good chance for an agreement later this year or in early 2020, as President Trump is likely to want to reach a deal prior to the 2020 election and might be willing to accept more incremental reforms than the US had initially sought.


A very long read but worth it.
Thank you very much!