
How Are Markets Higher: Buyers' Strike Continues For 12th Straight Week
The most perplexing aspect of the post-Christmas stock rally, which has sent the SPX almost 20% higher from its December lows, continues to confound investors.
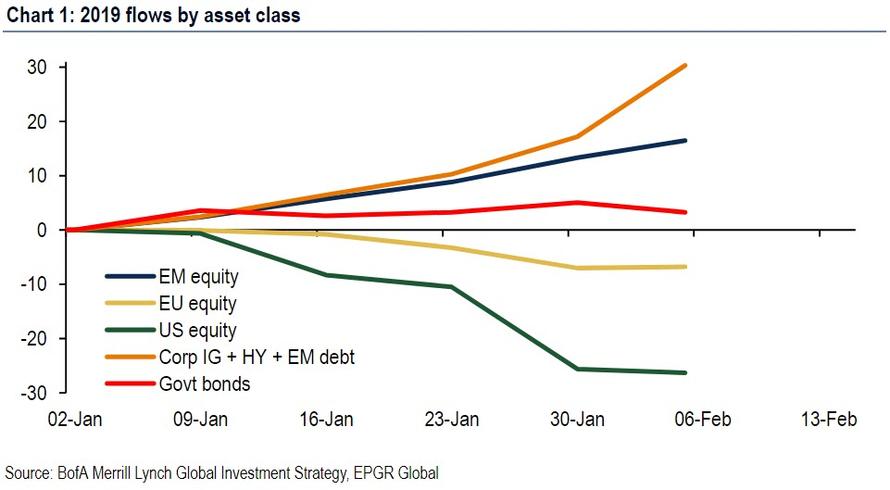
As we discussed last week, and the week before that, one of the more bizarre observations to emerge over the past nine weeks has been that despite the torrid rebound in stocks so far in 2019, culminating with the best January for the S&P since 1987, investors have shunned US equities, selling stocks when they should be buying, and allocating the proceeds into "yielding" instruments such as bonds and emerging markets, as the following recent chart from Bank of America demonstrated.
(Click on image to enlarge)
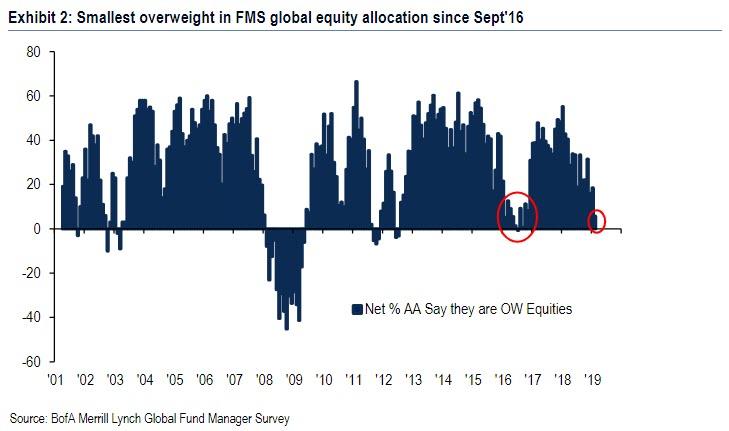
This was confirmed by the latest Fund Managers' Survey from BofA, which found that the allocation to global equities tumbled 12% to just net 6% overweight in February, the lowest level since September 2016, and the biggest MoM drop relative to the performance of global equities (+7% from Jan 4th start of Jan'19 survey) to Feb 7th (end of Feb'19 survey) on record. This confirms that neither professional nor retail investors have any faith in the current rally.
(Click on image to enlarge)
And now, according to the latest weekly EPFR data, the conundrum refuses to go away for yet another week, because despite the latest breakout in stocks, which are just a few points away from the "massive resistance" level that is 2,800 but their Sept 20 all time highs, the selling continues unabated, with global equity funds sees another $12.7 billion in outflows ($1.1bn ETF outflows, $11.6bn mutual fund outflows).
Even more surprising is that the equity revulsion turned broader, as this was the first week of EM debt ($39MM) and equity ($0.5BN) outflows since October 2018, while inflows into IG and HY debt continued, while the now historic redemptions continued from European equity, while financials, tech & energy funds all saw a drop.
The picture for equity funds targeting the US stocks was even worse, as US equity funds saw a $4.6 billion outflow in the latest week, the 12th consecutive week of outflows according to BofA, in other words for the entire duration of the past 9 weeks rally, investors have been continuously selling stocks.
(Click on image to enlarge)
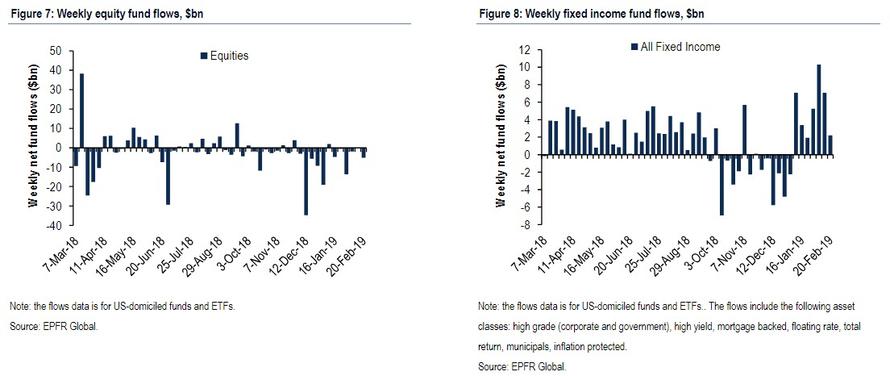
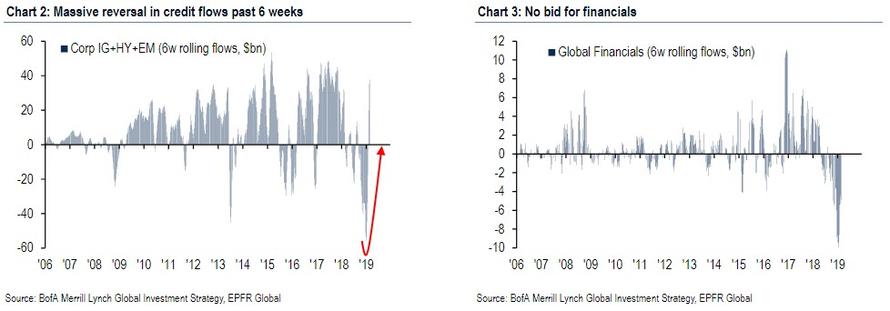
Instead of reallocating funds to risk despite the Fed's recent dovish relent, investors have continued to plow money into yield, with the last week seeing $4.6 billion in bond inflows including inflows to IG ($2.3bn) & HY ($0.5bn), and the recent trend of buying "yield" continuing with $36BN of IG/HY/EM debt allocated in past 6 weeks from the proceeds of selling of $51BN in developed market equities over the past 6 weeks, with an emphasis on selling economy-sensitive assets such as financial stocks which are simply unable to catch a bid.
(Click on image to enlarge)
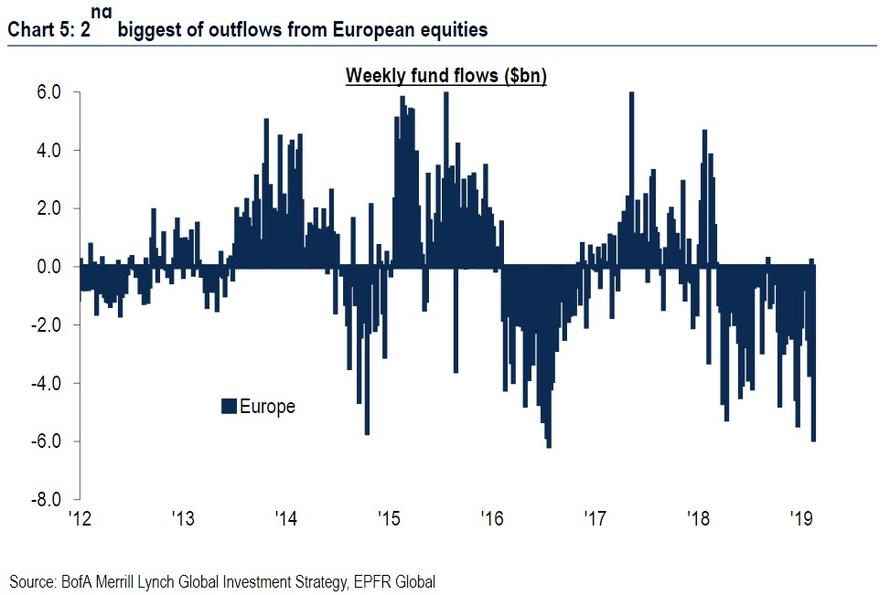
Meanwhile, while investors may hate the US, they absolutely loathe Europe, confirmed by yet another outflow, following the 2nd biggest outflow ever, with another $3.9BN pulled from European equity funds.
(Click on image to enlarge)
So while we know who is selling - virtually everyone - the question remains: who is buying stocks so aggressively as to push markets not only above their 200DMAs, but has sent the S&P 500 near 2,800.
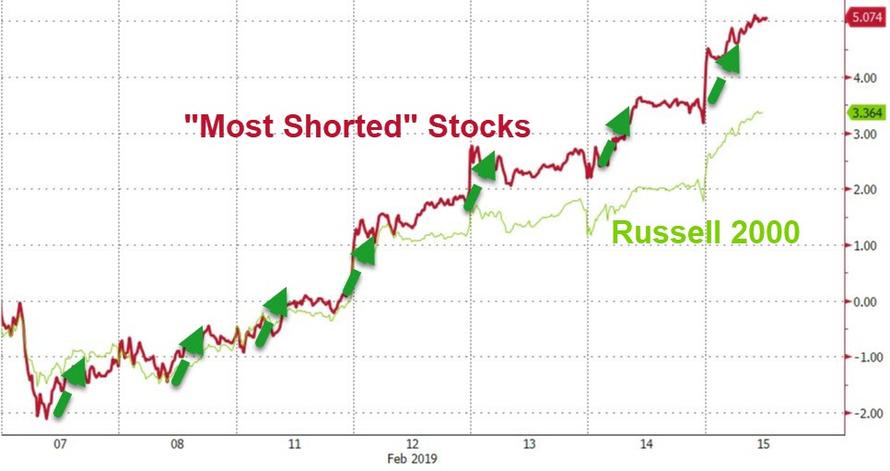
As we discussed last Wednesday, the answer is twofold: powerful force lifting stocks higher has been short covering, which we showed recently has been instrumental in if not so much lifting stocks higher, then certainly causing further distress to hedge funds, which just as they loaded up on shorts, found themselves rushing to cover.
(Click on image to enlarge)
But it is hardly likely that mere short selling has offset the 11 weeks of consecutive institutional and retail sales since the December lows. Which brings us to the second, and highly politically charged, answer: stock buybacks. As Bank of America showed earlier this week, corporate buybacks last week not only offset the selling by all of the bank's other clients, leading clients to remain aggregate buyers of single stocks overall...
(Click on image to enlarge)
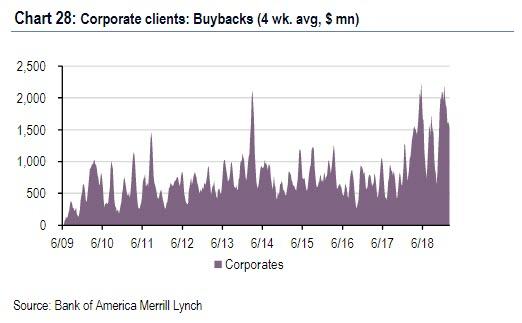
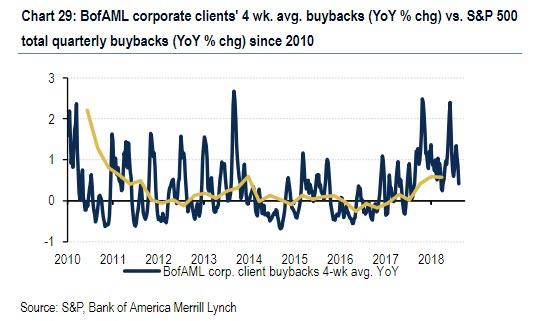
... but on a year-to-date basis, buybacks are already tracking far above last year's records, and are in fact a whopping +91% higher compared to the same period in 2018, and as BofA notes, Buybacks by corporate clients picked up to their fourth-largest weekly level in the bank's data history (since 2009), suggesting another record year.
(Click on image to enlarge)
Which begs yet another question: if investors have boycotted the "easy" upside from the past 2 months, will they finally jump in, as Nomura's Charlie McElligott wrote last week at just the most "dangerous" time, or will the boycott persist until buybacks are finally exhausted and the market finally tumbles?


