
Housing Market Review (November, 2018) – The Federal Reserve Takes Note As Housing Deepens Its Slowdown

Home builders are pulling out the stops to get homes sold.
I saw a flicker of hope for home builders in the May Housing Market Review. Traders decided to snuff that flicker out very quickly afterward. When I wrote June’s housing market review and described a “struggling flicker,” the iShares US Home Construction ETF (ITB) was once again bouncing off the bottom of 2018’s trading range. By the time of the September Housing Market Review, ITB was still holding to its trading range, but weakening housing data made for a precarious outlook. In September, ITB finally broke down and hit a 13-month low. October ushered in a complete collapse that was very plunge-worthy. After surviving another dip, ITB gained 3.8% in November in a small sign of stabilization. The index is now on the edge of an important breakout above its declining 50-day moving average (DMA) resistance. A clean breakout would confirm that the market has finally adjusted to the lower profile for the housing market.
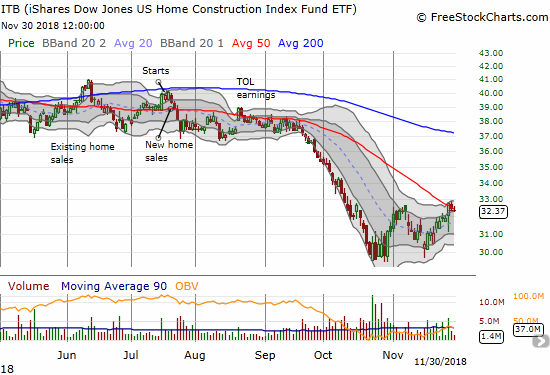
The iShares US Home Construction ETF (ITB) is struggling to break through critical 50DMA resistance.
Conditions got bad enough in October that analysts started issuing downgrades. These downgrades can still have an impact in a trading environment that is vastly improved from October. On Friday, November 30th, RBC left its rating on Toll Brothers (TOL) at outperform but dropped its guidance for 2019 order growth. That ding was enough to knock TOL’s price down 1.9% on the day. The stock ended down 2.0% for the month after stopping just short of its highest price of the month.
The deteriorating conditions in the housing market also caught the notice of the Federal Reserve. The minutes from the November meeting included some very telling quotes:
“Real residential investment declined further in the third quarter, likely reflecting a range of factors including the continued effects of rising mortgage interest rates on the affordability of housing…
Most borrowers in the residential mortgage market continued to experience accommodative financing conditions, although the increase in mortgage rates since 2016 appeared to have reduced housing demand, and financing conditions remained somewhat tight for borrowers with low credit scores. Growth in home-purchase mortgage originations slowed over the past year as mortgage rates stayed near their highest level since 2011, and refinancing activity continued to be very muted.”
I will be keenly interested to see whether the Fed surfaces issues in the housing market as a driver of whatever decision it makes on monetary policy in its upcoming December meeting. I am sure the wording will be carefully crafted to avoid creating panic about the housing market.
New Residential Construction (Single-Family Housing Starts) – October, 2018
While housing starts surged in May and left no doubt that home builders were confident as ever, the subsequent plunge in housing starts in June appeared to temper that enthusiastic interpretation. Small increases from July through October seem to have stabilized things for now. This stabilization is no longer much solace in the context of a housing market that has apparently peaked for the foreseeable future.
Single-family housing starts for September were revised significantly upward for the second straight month from 871,000 to 881,000. October starts decreased month-over-month by 1.8% to 865,000. On an annual basis, single-family housing starts decreased by 2.6%. This decrease is the third in the last five months. June’s year-over-year decline was the first for housing starts since August, 2016, and June’s level sits as the lowest of the year. These recent annual declines are relatively significant. I am no longer worrying that something important has fundamentally changed in the housing market: I have concluded that the fundamental change is here as confirmed by the builder sentiment readings (see below). The breakdown in slow motion continues.
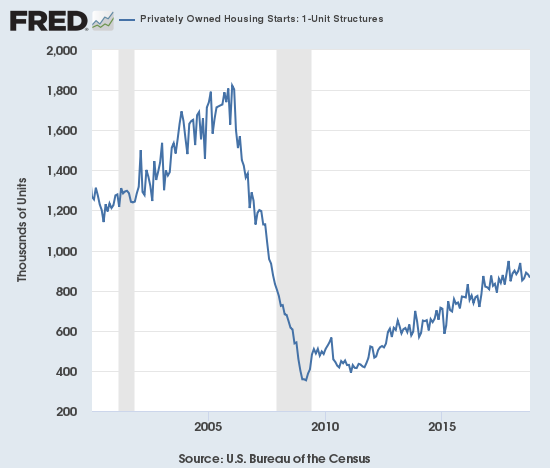
The post-recession uptrend in starts has apparently come to an end. Can starts at least remain in a period of stabilization?
Source: US. Bureau of the Census, Privately Owned Housing Starts: 1-Unit Structures [HOUST1F], retrieved from FRED, Federal Reserve Bank of St. Louis, November 20, 2018.
Over the 8 months prior to May, regional year-over-year changes in starts exhibited wide dispersion. For May, housing starts were very strong across the board. The dispersion returned in July and has remained since then. For October, the Northeast, Midwest, South, and West each changed 9.4%, -11.8%, -10.1%, and 17.6% respectively. The bump up in July housing starts was less impressive than it appeared given it was mainly driven by the Midwest. For August, only a second month of gains for the West prevented housing starts from looking worse. In September, the regions delivered solid performances outside of the Northeast. The surge in starts in the West particularly stands out given it follows a 10.4% year-over-year gain in September. The West is out-performing and overall starts would look a lot worse otherwise. Assuming a housing slowdown is in full swing, the West could suffer significant drops in home builder sentiment in coming months as these strong starts turn into over-supply and/or lower prices.
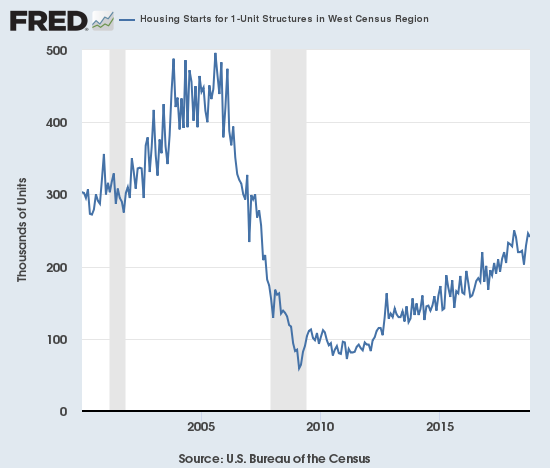
While 1-unit housing starts top out on a national basis, the West is surprisingly holding close to its post-recession highs thanks to a September jump.
Source: U.S. Bureau of the Census and U.S. Department of Housing and Urban Development, Housing Starts for 1-Unit Structures in West Census Region [HOUSTW1F], retrieved from FRED, Federal Reserve Bank of St. Louis; November 21, 2018.
Existing Home Sales – October, 2018
Existing home sales ended a 5-month losing streak with a small month-over-month increase for October sales. However, sales continued its losing streak for year-over-year changes with an eighth annual decline in a row. For August sales, the National Association of Realtors (NAR) chose to celebrate headlines about a stabilization of sales and the end of the decline, but I countered with my skepticism. For September sales, the NAR seemed to finally acknowledge a sinking reality. However, the NAR perked back up in reporting the October sales with mixed messaging that failed to highlight the fundamental realities of a slowing market.
The seasonally adjusted annualized sales in October of 5.22M were up 1.4% month-over-month from the unrevised 5.15M in sales for September. Year-over-year sales decreased 5.1%.

There is little room for optimism in this chart: the trend for existing home sales remains definitively down despite a small month-over-month bump in October.
Source for chart: National Association of Realtors, Existing Home Sales© [EXHOSLUSM495S], retrieved from FRED, Federal Reserve Bank of St. Louis, December 2, 2018.
The NAR’s routine explanation for changes in existing sales has usually blamed sales declines on a shortage of inventory and celebrated sales increases in spite of inventory shortages. The report on October sales bounced around and even cherry-picked timeframes. The NAR strained to paint a story of increasing demand. The NAR used the monthly gain in sales to celebrate: “After six consecutive months of decline, buyers are finally stepping back into the housing market…” Yet the substantial year-over-year decline means that the more meaningful trend remains downward. The NAR switched to a year-over view to celebrate an increase in inventory: “increasing housing inventory has brought more buyers to the market.” Absolute inventory levels increased from 1.8M a year ago to 1.85M in October. Inventory FELL over the time period where sales actually increased: from 1.88M in September. On a basis of months of supply, inventory followed the trend in the absolute numbers: “Unsold inventory is at a 4.3-month supply at the current sales pace, down from 4.4 last month and up from 3.9 months a year ago.”
Out of this mix, the NAR suggested that “as more inventory enters the market and we head into the winter season, home price growth has begun to slow more meaningfully…This allows for much more manageable, less frenzied buying conditions.” This description is a pretty good positive spin on slowing price growth. The NAR depicts inventory as if it has increased under its own internal forces – perhaps more people are simply interested in selling their homes. I think the better description is one where softening demand has caused an increase in inventory and slower price growth. The NAR chose to acknowledge the year-over-year sales decline to highlight affordability challenges from higher rates; the NAR recommended that buyers hire a realtor to help navigate these challenges.
In another interesting twist, the NAR seemed to imply that the declines are concentrated with first-time home buyers. The NAR took this opportunity to lobby the Federal Reserve to reconsider its monetary policy:
“Rising interest rates and increasing home prices continue to suppress the rate of first-time homebuyers. Home sales could further decline before stabilizing. The Federal Reserve should, therefore, re-evaluate its monetary policy of tightening credit, especially in light of softening inflationary pressures, to help ease the financial burden on potential first-time buyers and assure a slump in the market causes no lasting damage to the economy…”
When sales fell both monthly and annually for September, the NAR had to concede at the time that there is “…without a doubt a clear shift in the market.” The report for October sales would have been more accurate if the NAR noted that the numbers confirmed the “clear shift” in the market.
The “cross-over” in June when inventory increased year-over-year for the first time since June, 2015 was the beginning of a trend. The 1.85M existing homes for sale is down 1.6% from September, but inventory is up 2.7% year-over-year. The 4.3 months of supply is a slight decrease from September’s 4.4 and up notably from the 3.9 a year ago.
The share of sales going to first-time buyers continues to just bounce around even as the NAR tries to draw significance from each monthly change. For October, the share sat at 31%, a decrease from 32% the previous month and the previous year’s October. This share was 31% in August, 32% in July, 31% in May and June, 33% in April, 30% in March, 29% in February and November was 33%. September, 2017 was the first time in the previous two years where the share dropped below 30% and has not dropped below since. In other words, the share is doing relatively well over the past year.
The average share for first-time homebuyers for 2016 was 35%. The NAR’s 2017 Profile of Home Buyers and Sellers reported an average of 34% for 2017. Investors purchased 15% of homes in September, a notable jump from the 13% share over the four months. Investor sales averaged a share of 15% in 2017 and 14% in 2016. This change, if sustained, could further confirm a change in the market where investors are stepping to replaced some of the softening demand from other home buyers.
Existing home sales decreased across all four regions year-over-year and told an even more stark real story of continued decline. In particular, the West suffered a fourth consecutive substantial drop. Here are the regional numbers with September’s year-over-year changes in parentheses for comparison: Northeast -6.8% (-5.6%), Midwest -3.1% (-1.5%), South -2.3% (-0.5%), West -11.2% (-12.2%). As usual, regional sale fluctuations had no relationship to the on-going price run-ups. The year-over-year price changes for October were again relatively robust (the September changes in parentheses to show that the NAR should not celebrate a slowdown in price growth just yet): Northeast 3.0% (4.1%), Midwest 2.4% (1.9%), South 3.8% (3.0%), West 1.9% (4.1%). If not for the relatively steady first-time homebuyer numbers and on-going sales declines in the West, I would have assumed that higher-end homes are increasingly dominating existing home sales.
October’s 3.8% year-over-year increase in the overall median price of an existing home delivered the 80th consecutive month with a year-over-year increase. The median price of $255,400 is the fourth consecutive month-over-month decline. Given the sales declines, the NAR’s earlier optimism over four (now six) straight months of annual price gains below 5% is looking like a “watch what you wish for moment.”
Single-family sales were up on a monthly basis and decreased on a yearly basis by 5.3%. The median price of $257,900 was up 4.3% year-over-year.
New Residential Sales (Single-Family) – October, 2018
New home sales were resurgent in March. April sales did not keep pace on a monthly basis but delivered a strong year-over-year performance. In a surprisingly stark contrast to existing home sales, new home sales from May to August increased in each month on a year-over-year basis. September finally unleashed a “pent-up” decline in new home sales commensurate with existing home sales. This decline provided a final confirmation that November, 2017 delivered a substantial and sustained peak in new home sales. The declines continued in October. Unlike the NAR’s spin on existing home sales, there is no amount of spin to hide the bearishness of the decline in new home sales.
The Census Bureau revised September sales of new single-family homes significantly upward from 553,000 to 597,000; five of the last seven months have delivered sizable downward revisions. While earlier I thought that the downward revisions were yet one more bad sign of a declining market, perhaps the economists are simply having trouble adjusting to the new downward trajectory (I sent an inquiry). New home sales for October decreased 8.9% month-over-month and sharply declined 12.0% year-over-year to 544,000. It was the lowest level of new home sales since March, 2016 at 538,000 sales. Year-over-year gains regularly hit double digits starting in 2012; last November’s 26.6% jump was the highest since February, 2015 when new home sales soared 29.8% year-over-year. This year never delivered a double-digit year-over-year gain, so the current declines are consistent with a slowdown in new home sales. The graph below makes plain the significant and ominous break in trend.
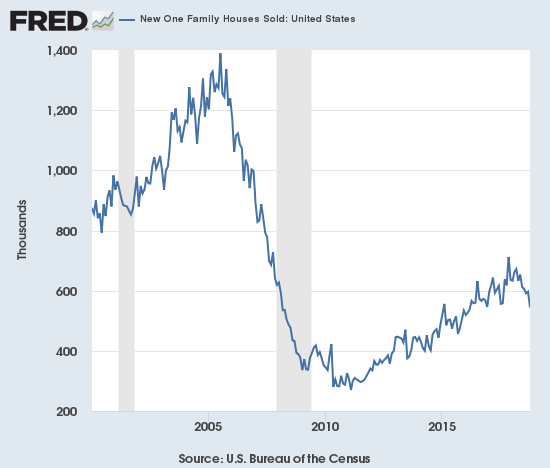
New home sales have taken a noticeable plunge in recent months. The nice post-trough uptrend is definitively over.
Source: US. Bureau of the Census, New One Family Houses Sold: United States [HSN1F], retrieved from FRED, Federal Reserve Bank of St. Louis, December 2, 2018.
In December, the inventory of new homes increased to 5.5 months of supply. A market for homes is in balance at 6 months of supply. March’s inventory stood at 5.3 months. For June, inventory jumped back up to 6.0 months of sales, a perfect balance. Inventory has continued to increase from there. September’s inventory surged to 7.2. October’s inventory increased further to 8.1! In September’s Housing Market Review I wondered whether new homes might move too far to an over-supply condition; sure enough this is exactly what has happened. In fact, the over-supply has reached an extreme beyond my worst fears. Inventory was last this bad in late 2010 and early 2011. An over-supply of new homes still detracts from the abiding optimism expressed by the NAR over higher supplies of existing homes. The swelling supply will also discourage builders from doing the kind of building the NAR wants to see.
May’s median price of $316,700 was a year-over-year decline. June delivered a second straight decline. July’s prices bounced back: the median price increased 1.6%. August’s median price of $319,200 was also a year-over-year increase of 1.6%. With sales plunging in September it was no surprise that prices dropped year-over-year as well: the median declined 3.1% (revised), the average was essentially flat (revised). For October, the median dropped again by 3.1%. The average increased ever so slightly by 0.3%. The price declines sit in stark contrast to the persistent increase in price for existing homes and likely are a leading indicator of the price dynamics for the market as a whole…assuming that softening demand for new homes is bleeding into lower appetites for higher-priced existing homes.
The Northeast was a notable laggard for the fourth straight month with a whopping year-over-year sales decline of 46.3%. The Midwest dropped 16.7%. The South dropped 11.6%. The West surprisingly only fell 1.3% (compare to the plunge in the West’s existing home sales). The Northeast has been extremely volatile for many months now. The Midwest ended a streak of multi-month growth.
Home Builder Confidence: The Housing Market Index – November, 2018
In the April housing market review, I explained why I would not have thought much of March’s slight decline in the Housing Market Index (HMI). At 70, the HMI was still higher than it was for most of 2017. For July, the HMI stayed at 68 for the second straight month. However, the HMI dropped another point in August and stayed at 67 for September. For two straight months, the NAHB cleverly called 67 a “solid reading.” I was circumspect about this reading given it was the low for 2018, and I stayed skeptical in the October Housing Market Review even with the HMI increasing by one point at that time. As a reminder, I took the NAHB’s quote as evidence that a housing slowdown was underway (emphasis mine):
“Favorable economic conditions and demographic tailwinds should continue to support demand, but housing affordability has become a challenge due to ongoing price and interest rate increases. Unless housing affordability stabilizes, the market risks losing additional momentum as we head into 2019.”
The slowdown showed up in the November HMI which dropped from 68 in October to 60, the lowest reading since June, 2016. Not only is the 12% drop the largest since an 18% drop in February, 2014, but also the 14% year-over-year plunge is the largest since a 19% year-over-year decline in June, 2011. The last time the HMI hit a low this late in the year was in the depths of the financial crisis. Still, despite all these bad milestones, the 68.1 average HMI year-to-date is still just a bit higher than 2017’s average HMI of 67.8. Thus, the NAHB can find solace in observing: “Despite the sharp drop, builder sentiment still remains in positive territory.” “Positive” means it is above 50. However, clinging to that positive sign is near meaningless since HMI was last below 50 in June, 2014, just two years or so after the housing trough and in the middle of a rapid recovery in sentiment. The components of the HMI would have to suffer significant blows from current levels to drive HMI below 50.
The components of HMI reveal the clearest warning on sentiment. The traffic of prospective buyers soared to a remarkable peak in December, 2017 and has mainly declined from there. November’s drop all the way to 45 makes last year’s top look like a lasting top. Similarly, the other two components of the HMI, single-family detached present and single-family detached six months, have steadily declined for 11 months. A lasting peak in those components is harder to assess because neither component soared as sharply as the traffic of prospective buyers.
(Click on image to enlarge)
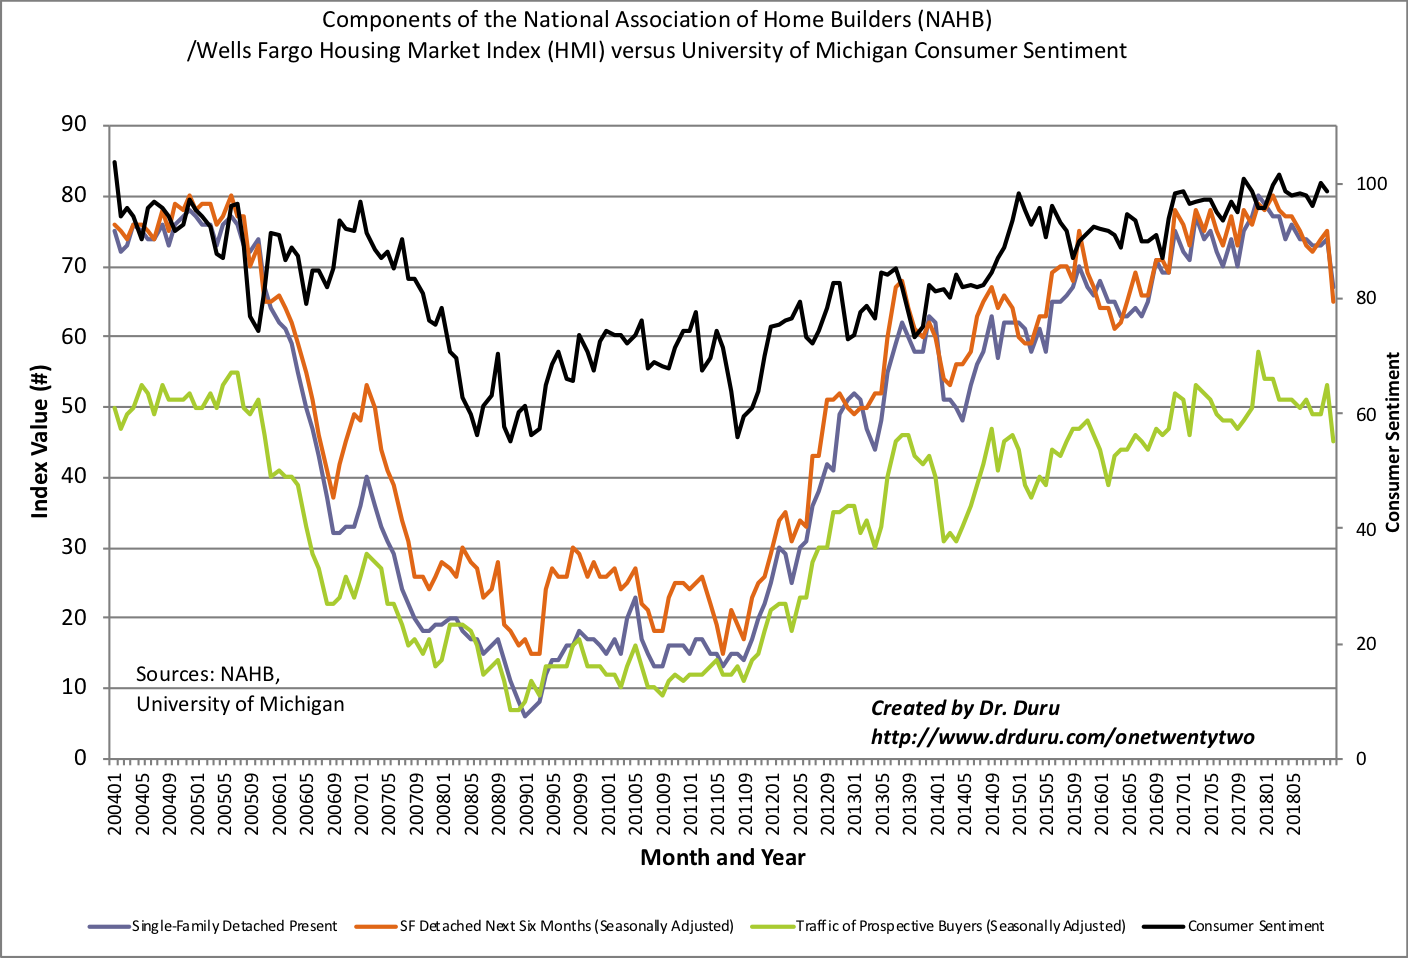
The components of home builder sentiment fell sharply across the board. The Housing Market Index (HMI) looks like it hit a lasting peak late last year.
Source: NAHB
The rest of the statement from the NAHB was very telling. I hope the NAHB sent a link directly to the Federal Reserve. The NAHB recommended that “policy makers” start paying more attention to residential housing as a lead indicator on the economy. The NAHB pointed to a 10-year low in affordability and an increase of caution among home buyers and builders alike as causes for concern. The NAHB could have easily copied the following observation from last week’s earnings warning from KB Home (KBH):
“Builders report that they continue to see signs of consumer demand for new homes but that customers are taking a pause due to concerns over rising interest rates and home prices…”
The underlying and unstated implication: the housing market is slowing down and ever higher rates threaten to throw the sector into a full-blown recession. Add housing to the forces steadily boxing in the Fed.
All four regional HMIs declined sharply. Only the Northeast avoided a new low for the year. The Northeast and the Midwest are close to the 50 threshold at 52 and 54 respectively. The Midwest has not been this low since December, 2015. The South hit a 14-month low. The West is the worst region on a relative basis with a reading of 65 that was last seen in September, 2015.
In the October Housing Market Review, I claimed that home builder sentiment would be a key tell in the coming months. In the September Housing Market Review, I concluded that HMI had to begin a recovery in October for me to look forward more optimistically to the seasonally strong period for home builder stocks (November through March/April). Unfortunately, I concluded that “…home builder sentiment still looks like a breakdown in slow motion.” The brakes are now off, the breakdown is in full effect and it picked up speed in a hurry. Amazingly, the iShares US Home Construction ETF (ITB) held steady on a day where the S&P 500 (SPY) dropped 1.7% and the NASDAQ plunged 3.0% to a new 7-month low. Is it possible that 2018’s stubborn sell-off in ITB finally priced in the worst of the coming news for the housing market?
I am slowly testing out the stabilization without any expectation of a marked improvement in the housing data. I am already sticking to the ITB call options that I bought to launch the seasonal trade. Soon after I bought shares in Pulte Home (PHM) as a part of its impressive breakout. On Friday, I added shares in LGI Homes (LGIH) as it pulled back a bit from its own breakout.
Parting thoughts
Many news outlets are turning increasing attention to problems in various housing markets in the U.S. In its latest “Make Me Smart” segment, Marketplace produced a podcast titled “The affordability crisis of house and home.” The story focused on a couple who feels “stuck” in their starter home because prices are increasing too fast around them to afford a move-up. The podcast described the abiding nervousness some feel about the decline in the housing market given the lingering scars from the financial crisis. The experts referenced in the podcast apparently expect a soft landing and normalization in the housing market. I am not surprised since the natural and reasonable caution of experts prevents them from getting too far ahead of the existing data, especially if they are anchored to particular economic (or mental) models.
Disclosure: Long ITB calls, long PHM, long LGIH.
Follow Dr. Duru’s commentary on financial markets via more


