
Housing Market Review – Spring Looks Ready To Bloom But Will It Bear Fruit? (March, 2017)
The last Housing Market Review covered data reported in February, 2017 for January, 2017. At that time, the iShares US Home Construction (ITB) was pressing against a near 10-year high. Uptrends in the 20, 50, and 200-day moving average suggested that “the coiled spring” was uncurling up and to the right. In March, ITB launched into that near 10-year high. Strong reports from the housing market and solid earnings reports combined with an initially benign response to another rate hike from the U.S. Federal Reserve to lift ITB to higher heights. While ITB swooned with the general stock market in the last week, the ETF holds a solid lead over the S&P 500 (SPY) as the seasonally strong period for housing stocks continues apace.
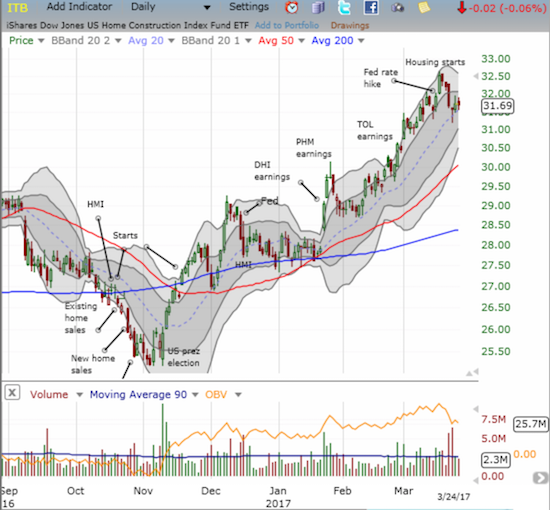
The iShares US Home Construction (ITB) surged in March. The current test of the 20-day moving average (DMA) demonstrates the strength of the current uptrend.
Source: FreeStockCharts.com
In the month of January, accelerating existing home sales contrasted with decelerating new home sales. For February, the two flipped around. Homebuilder sentiment once again stood in the balance. After two consecutive down months, sentiment resynchronized with housing starts and spurted higher to a new post-recession high. ITB looks like it is setting up for its next up-leg but larger issues may loom for home builder stocks. If confidence wanes in the ability of the Federal government to deliver on regulatory relief and tax reform, then home builder stocks could easily sell-off further with the market. Given the seasonally strong period for homebuilders is coming to an end soon, I will no longer look to buy dips aggressively (perhaps the summer?). I plan to continue holding the few home builder stocks that I own (Toll Brothers (TOL), Century Communities (CCS), and Tri Pointe Group (TPH)). I am also holding Invitation Homes Inc. (INVH) as a long-term secular play on rental housing.
New Residential Construction (Housing Starts) – February, 2017
Single-family housing starts for January were revised slightly downward from 823,000 to 819,000. February starts managed a significant monthly gain of 6.5% to 872,000. This change reaffirms the post-recession uptrend. On an annual basis, single-family housing starts leapt 13.5%, above January’s year-over-year increase of 11.1%.
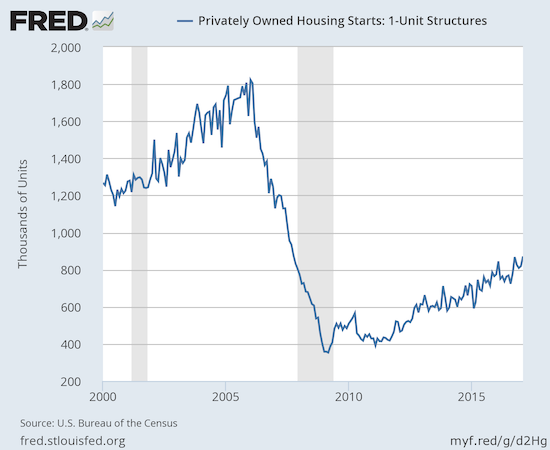
The post-recession uptrend picked up steam again in February.
Source: US. Bureau of the Census, Privately Owned Housing Starts: 1-Unit Structures [HOUST1F], retrieved from FRED, Federal Reserve Bank of St. Louis, March 16, 2017.
Across the regions, starts were up double digit percentages year-over-year except the Northeast which edged upward 3.8%. The West returned to gains with a 10.8% jump, close to December’s 13.5% gain. January delivered a 1.2% drop. The South was the big winner for a second month in a row with a 16.1% gain that just missed January’s large 17.4% year-over-year jump. The Midwest gained 13.2%.
Existing Home Sales – February, 2017
For January, existing home sales returned to gains and hit levels not seen since February, 2007. For February, existing home sales dropped sharply from the previous month’s post-recession high and served up a reminder of the month-to-month volatility in this series. Although year-over-year sales were still up, the National Association of Realtors (NAR) reverted to the sober tones it reserves for down months:
“Realtors® are reporting stronger foot traffic from a year ago, but low supply in the affordable price range continues to be the pest that’s pushing up price growth and pressuring the budgets of prospective buyers…Newly listed properties are being snatched up quickly so far this year and leaving behind minimal choices for buyers trying to reach the market.”
The seasonally adjusted annualized sales of 5.48M were down 3.7% month-over-month from an unrevised 5.69M in sales for December. Year-over-year sales increased a healthy 5.4% (compare to November’s 15.4% year-over-year pop, December’s 0.7% increase, and January’s 3.8% rise). Sales dropped to levels last seen September, 2016.
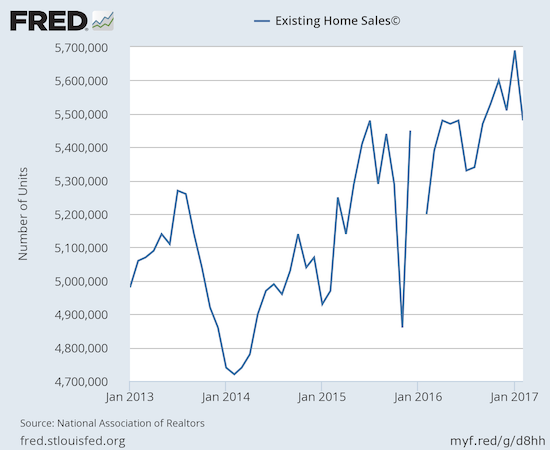
February existing home sales fall sharply off the post-recession high but the recent uptrend remains well intact.(recall that the NAR no longer makes data available before 2013. For more historical data to 1999
click here)
Source: National Association of Realtors, Existing Home Sales© [EXHOSLUSM495S], retrieved from FRED, Federal Reserve Bank of St. Louis, March 24, 2016.
Putting aside the NAR’s swings with the monthly volatility, the main headline for existing sales is the fact they have consistently trended upward despite all the reported and now well-known headwinds. The jump in sales in January demonstrated the strength in the housing market despite scarce inventory and the resulting increase in prices. The monthly decline in February did not erase that strength, especially considering year-over-year sales were up. Even first-time buyers are hanging in there. In February, first-timers were 32% of sales, down just one percentage point from December and January and up two percentage points from a year ago. The average for 2016 was 35%.
The absolute level of inventory of existing homes has fallen year-over-year for 21 straight months. The 1.75M homes for sale represented a 6.4% decrease from the previous February. The recent year-over-year declines have been remarkable: August -10.1%, September -6.8%, October -4.3%, November -9.3%, December -6.3%, and January -7.1%. In December, inventory hit a new absolute low measured from 1999 when the NAR began tracking. Now, inventory has managed to increase month-over-month for the second month in a row with a 4.2% increase. Moreover, inventory increased from 3.5 months of sales in January to 3.8 in February. In December, inventory was at 3.6. So while inventory is extremely out of balance with demand, the small increase relative to demand suggests that constrained inventory is insufficient to explain February’s increase in the median price or the drop in sales. There were likely certain price ranges that experienced notably disproportionate increases in price and drops in sales (per the NAR, I am guessing these dynamics played out in the “affordable” price ranges).
The Nightly Business Report once again seized upon a supply shortage as a jey headline for existing home sales. The most intriguing part of the story below is that investors who scooped up bargains during the housing crash are not selling rental properties back into the market as expected. Housing market watchers may recall that this “pending inventory” was part of the story housing bears told to predict on-going doom and gloom for housing. Investors are enjoying the positive cash flow with price appreciation as “extra gravy.”
Investors purchased 17% of existing homes in February, up from 15% in January (and December, 2016) and down from 18% in February, 2016 (which was the highest share since April, 2014). In October that share dropped from 14% to 13% which was the same share in August. In November, investor share of sales dropped to 12%. The share was 11% in July. As context, recall July’s share was the lowest share since 9% in July, 2009. Clearly, investor appetite is far from satiated even as the month-to-month share of sales has demonstrated significant volatility.
The South was the only region to experience a monthly gain in existing home sales. All regions logged year-over-year sales gains: Northeast 1.5%, Midwest 2.5%, South 5.9%, West 9.6%. All regions logged impressive year-over-year price jumps: Northeast 4.1%, Midwest 6.1%, South 9.6%, West 9.6%. The price surges in the South and West make the strong annual sales increases in those regions even more impressive given the NAR has blamed high prices for lower sales in the national numbers.
February’s 7.7% year-over-year increase in the overall median price of an existing home represents the 60th consecutive month of year-over-year increases. The median price of $228,400 is an insignificant decline from January’s $228,900. The all-time record continues to fade into the distance ($247,700 set in June, 2016). Thus, it is increasingly possible that a year-over-year DECLINE in price may finally occur this year (watch how the housing bears growl over THAT headline!).
Single-family sales dropped on a monthly basis (3.0%) and increased on a yearly basis by 5.8%. November’s 16.2% year-over-year surge was definitely an anomaly. The median price of $229,900 dropped below January’s $230,400 and continues a string of monthly declines (December was at $233,500 and November was at $236,500) although price increased 7.6% year-over-year. Like overall existing home sales, it looks like 2017 could be the year when a year-over-year decline in price actually happens for single-family homes.
“Single-family home sales declined 3.0 percent to a seasonally adjusted annual rate of 4.89 million in February from 5.04 million in January, and are now 5.8 percent above the 4.62 million pace a year ago. The median existing single-family home price was $229,900 in February, up 7.6 percent from February 2016.”
New Residential Sales – February, 2017
New home sales were the big headline last August as July sales soared to 622,000 and a fresh post-recession high. I predicted that post-recession peak would not get challenged until the next Spring selling season. That prediction looks ready to come to fruition as February new home sales hit 592,000, a 6.1% gain over February and a 12.8% year-over-year gain.
New single-family home sales for January were revised slightly upward to 558,000 from 555,000. Recall that December brought an end to an impressive streak of year-over-year gains: November +17.7%, October +17.8%, September +24.9%, August +10.7%, July +24.9%, and June +18.2%. When January’s print hit “only” 5.5% I declared an end to the hot streak. Clearly, I was pre-mature!
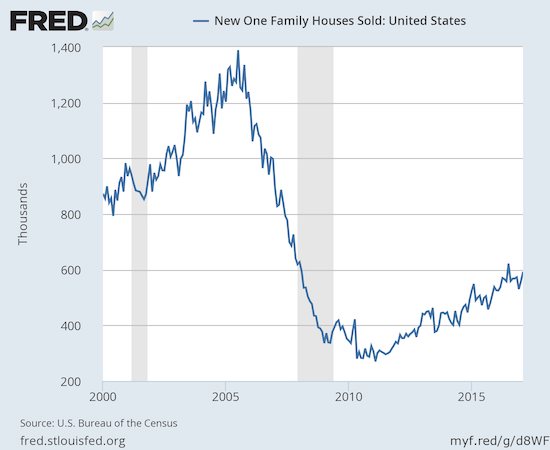
New home sales are picking up enough steam to challenge last year’s post-recession high.
Source: US. Bureau of the Census, New One Family Houses Sold: United States [HSN1F], retrieved from FRED, Federal Reserve Bank of St. Louis, March 26, 2017.
New home inventory dropped to 5.7 from 5.4 months of supply. This level sits in (surprisingly) sharp contrast with the much more scarce inventory of existing homes. As a result, I do not think the relatively slow pace of home building can explain much of the strain on the inventory of existing home sales. Recall that the market is in balance at 6 months of supply.
New home sales again exhibited a large range of year-over-year changes across regions, all positive. The Northeast continued to cool down from December’s torrid 48.4% gain with a 22.2% gain for January and now a 13.8% gain for February. The Midwest surged by 50.8% and accounted for almost 1/3 of the year-over-year increase in new home sales in the country. The South gained 7.9%, and the West increased 6.8%.
Home Builder Confidence: The Housing Market Index– March, 2017
The Housing Market Index (HMI) was the most impressive data point of my Housing Market Review to end 2016. I thought the story for early 2017 would be a cooling of this red hot confidence. Instead, in March, builder confidence soared to a new 12-year high!
The Housing Market Index (HMI) registered at 71 for March. This is a 6 point surge from February and a 2 point hurdle over 2016’s historically strong close. I claimed in December that I did not expect confidence to get much higher than that 69 reading because sentiment was last that high at the top of the last housing bubble. This resurgence suggests that confidence could yet run higher and along with it even stronger fundamentals for the housing market.
The National Association of Home Builders (NAHB) implied in November that the HMI might drop in the wake of the election. In December, the NAHB gave credit to the election for a surge in the HMI. The NAHB took the two month pullback (January and February) in stride by implying that sentiment had overheated. With sentiment heating up again, the NAHB took a familiar cautionary tone:
“Builders are buoyed by President Trump’s actions on regulatory reform, particularly his recent executive order to rescind or revise the waters of the U.S. rule that impacts permitting…
While builders are clearly confident, we expect some moderation in the index moving forward…Builders continue to face a number of challenges, including rising material prices, higher mortgage rates, and shortages of lots and labor.”
All three components of the HMI surged with impressive one-month gains. The component for the traffic of prospective buyers made a particularly notable comeback with a new multi-year high.
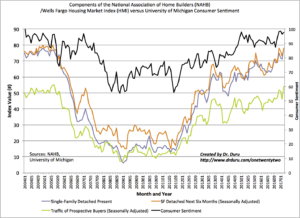
A freshly resurgent Housing Market Index (HMI) hit a new post-recession high.
Source: NAHB
The regional changes in HMI were somewhat mixed. Surprisingly, the West stayed relatively flat for the third month in a row. The sequence of 75, 76, and 77 make the 86 from December stand out like a huge anomaly. Against my residing assumption, the cap on sentiment on the West did NOT cap the overall HMI. Instead, the other three regions soared with the Midwest and the South (73 and 72 respectively) both surpassing December’s multi-year high. The Northeast soared to 53 but did not challenge December’s 57 reading.
This kind of volatility in the HMI is a bit unusual, so I am definitely on watch for a major and sustained shift in HMI’s trend and/or dynamics.
Parting thoughts
The Spring looks ready to bloom for the housing market. However, the impressive year-to-date results beg the question: will the stock market continue to reward strong results or will it get hesitant about post-Spring results? In other words, can we look forward to any fruit? This will not be a period for aggressively loading up on housing-related stocks, but sell-offs will likely be buying gifts.
KB Home (KBH) reported earnings in the middle of the stock market’s swoon. After an initial intraday sell-off, KBH came roaring back to close the day with a respectable 1.5% gain. The $19.61/share close fell right on top of the 2-year high set on March 16th (the day after the Fed hiked interest rates again). This resilience is an important sign that home builders just might fight through the current stock market weakness.
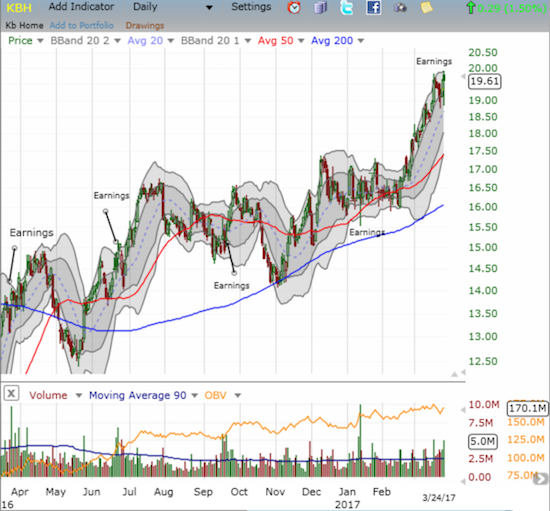
KB Home (KBH) makes a strong post-earnings comeback that ended with a tie with the 2-year high.
The chart above shows that since its collapse in early 2016, KBH has generally delivered well-received earnings reports. It seems sentiment on KBH has finally turned the corner. This juncture is important because short interest remains extremely high at 26.7% of float. The stock is cheap at just 0.5 price/sales, 1.0 price/book, and forward P/E 10.8. The 17.5 trailing P/E is a bit high. The key to KBH is increased guidance which included the magic phrase “pricing power.” From the Seeking Alpha transcript of the Q1 2017 conference call (emphasis mine):
“For the full year, we expect an increase in housing revenues as compared to our prior guidance, to the range of $4 billion to $4.3 billion…
Due to the strength of our first quarter, West Coast region net orders and net order value, we have increased our full year forecast for average selling price relative to prior guidance. We believe our overall average selling price for 2017 will be in the range of $385,000 to $395,000, representing a year-over-year increase of 6% to 9%. Our expectation of a continued strong spring selling season with enhanced pricing power across many of our markets could provide an additional uplift to our ASP in the fourth quarter.“
Altogether, KBH pushed itself to the top of “buy the dip” list for home builders. Note that KBH is already up 24.0% year-to-date.
Lennar Corp (LEN) also reported earnings last week. The stock was up 22.7% year-to-date ahead of earnings. LEN sold off mildly and currently has support at its uptrending 20DMA. On a larger pullback, I would look to buy on a test of support at its 50DMA.
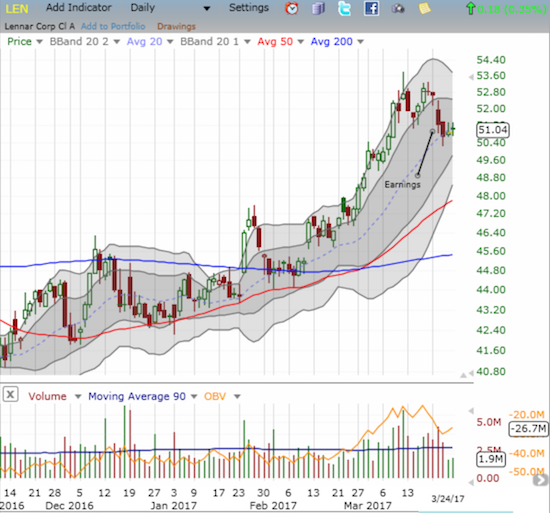
Lennar Corporation (LEN) pulled back slightly after reporting earnings. The strong year-to-date uptrend remains well intact.
Be careful out there!


