
Housing Data Is Mixed, But Expect A Strong Spring Season
Housing Data - Strong Market Index
We will review the 3 housing market reports from this week. Two were great and one wasn’t. Good news is February is looking good because of the decline in mortgage rates. Bad news is the January existing home sales report, which measures the majority of home sales, was weak.
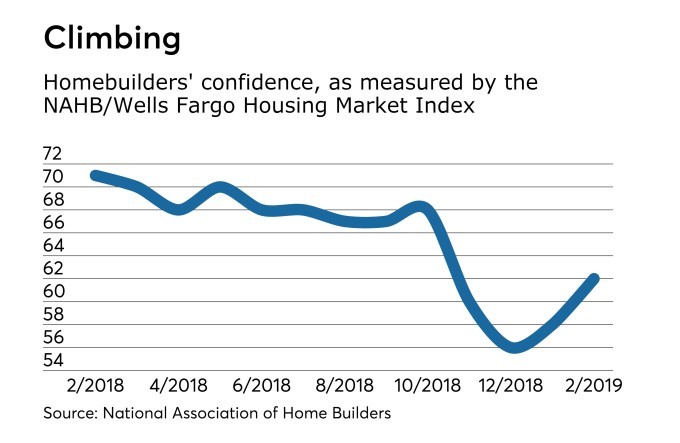
First, let’s look at the February housing market index. The HMI increased from 58 to 62 which beat the consensus for 59 and the high end of the consensus range which was 60.
As you can see from the chart below, the index is up from December where it bottomed at 56. The 30-year mortgage rate peaked at 4.94% in November and has since fallen to 4.35% as of February 21st.
It took a few weeks for the decline in interest rates to boost mortgage demand as it takes 50 days to close on a house. It’s a big decision to buy a house, so the move in rates needs to be substantial to increase demand.
December was also hurt by the government shutdown and stock market crash, which brought uncertainty to home buyers.
(Click on image to enlarge)
Present sales index was up 4 points to 67 and the 6-month forward sales index was up 5 points to 68. Traffic index was up 4 points to 48, which means it’s in contraction territory. I expect this spring to have a strong demand for housing because real wage growth is strong and the labor market is nearly full.
Plus, the stock market has rebounded and the government shutdown is over.
Housing Data - Moderation of home price growth and the interest rate decline make housing much more affordable.
The composite score in the West was the strongest as it increased to 67. South, which is the biggest existing housing market, was at 66. These are interesting readings because their existing home sales were very weak in January. Midwest’s index increased to 55. Northeast’s index was down to 45.
That means it was the only region that contracted. Northeast has expensive housing which is why it was especially hurt by the elimination of the state and local tax deduction cap of $10,000 for property taxes. Midwest has the most affordable housing.
Housing Data - MBA Applications Index Improves
Finally, after a few weeks of weakness which was preceded by strength to start the year, the MBA applications weekly index improved.
In the week of February 15th, the composite was up 3.6% after decreasing 3.7%. The purchase index was up 1.7% after declining by 6%. Its year over year growth rate was 2.5%, signaling the beginning of a strong spring selling season.
The refinance index was up 6.4% after falling 0.1%. Some people who bought a house in November or December are already looking to refinance their mortgage as their timing was terrible. I know someone who paid extra to lower their home interest rate in December only to see rates crater in January and February.
Consumers had expected rates and inflation to increase as of late last year, so they were surprised by the recent decline.
Housing Data - Terrible Existing Homes Report
Existing home sales report was terrible. Seasonally adjusted annual run rate in January was 4.94 million which missed estimates for 5.04 million. The prior month was revised higher to 5 million from 4.99 million. Even though that sounds like a small revision, it actually improved monthly growth from -6.4% to -4% and yearly growth from -10.3% to -4%.
As the chart below shows, existing home sales fell to a 3 year low in January. If you adjust for population, existing home sales have been falling this entire expansion.
That’s because supply has been low. That means a weak housing market has no chance of coming close to causing the same economic crisis that it did last recession. The housing market isn’t large enough to cause problems. This was the weakest expansion for home building ever.
In January, monthly existing home sales were down 1.2% and yearly sales were down 8.5%. Home sales were down 1.8% to a rate of 4.37 million and condos were up 3.6% to a rate of 570,000. Home sales dominate the overall number, bringing it lower.
(Click on image to enlarge)

Resale median prices were down 2.8% monthly to $247,500. Year over year prices were up 2.8%, but that’s the lowest growth since 2012.
Price growth could improve because demand should come from the strong consumer which will be helped by lower interest rates. This report shows discounting didn’t improve sales, which is a deadly combination.
But I don’t think that will last.
Housing Data - Best part of this report is that resales on the market increased by 3.9% to 1.59 million.
Supply of houses increased as the amount on the market was up and sales fell. Supply went from 3.7 months to 3.9 months. It was 3.4 months in December 2017. Increase in supply could hurt prices. But it will great for the consumer because many millennials need entry-level housing.
Baby boomers haven’t been moving out of their houses quickly, so this supply growth could be limited.
West’s existing housing market was the weakest region as resales fell 2.9% month over month and 13.8% year over year to a run rate of exactly 1 million. South, which is the largest market, was down 1% month over month, and 8.4% year over year to a run rate of 2.08 million. West and South had the strongest housing market index in February.
Housing Data - Conclusion
Existing home sales report is important because it measures the largest section of the housing market. Good news is that this doesn’t affect GDP growth. Nothing is being created; houses are simply changing hands.
However, I wouldn’t be surprised if new home sales were also weak in January. Hopefully, the improvement in the housing market index and the MBA purchase applications correctly predicts improvement in the housing market’s hard data.
It’s logical for the housing market to improve since the labor market is strong and interest rates have fallen.


