
Home Construction Index Down 42% From Its December 2017 High
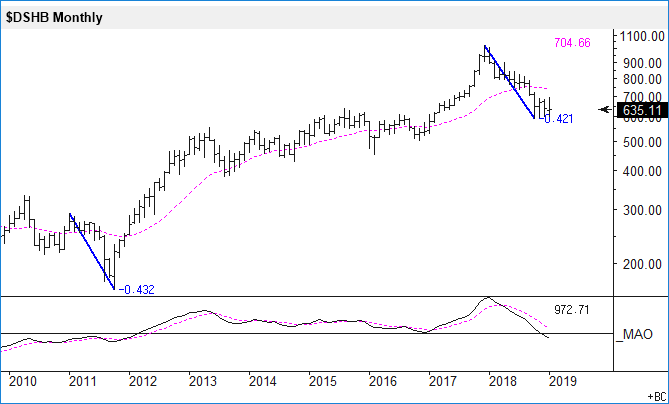
DJ U.S. Home Construction Index has held up better than the S&P 500 Index for the past two and a half months or so. As can be seen in the monthly chart below, the Index has been consolidating below its pink moving average line. The decline in 10-year treasury yields from 3.15 to current 2.65 level has helped the Index.
After a 12-month downswing, the Index is currently on an upswing (based on my proprietary method of defining swings). The moving average oscillator (MAO) has corrected back down. Price must rise to 704.66 for the moving average line to turn up and rise to 972.71 for the fast line of the MAO to cross its slow line to the upside. Also, note the blue symmetry lines. The push down in 2011 was 43.2% and the most recent push down is so far 42.1%, in both cases using intra-month highs and lows.
To me, the first sign that the Index is possibly recovering would be a solid close above its monthly moving average, which comes in around the 750 level. However, now there is selling pressure in the stock market so lower Index levels are more likely in the coming days and weeks.
Disclosure: The analysis provided here is usually part of the analysis the author uses when he is designing and managing his investment portfolios.
Disclaimer: The analysis presented ...
more

