
Home Builders About To Experience Super Bullish Breakout?
(Click on image to enlarge)
Is a very important sector of the U.S. economy about to experience a 13-year breakout? Possible!
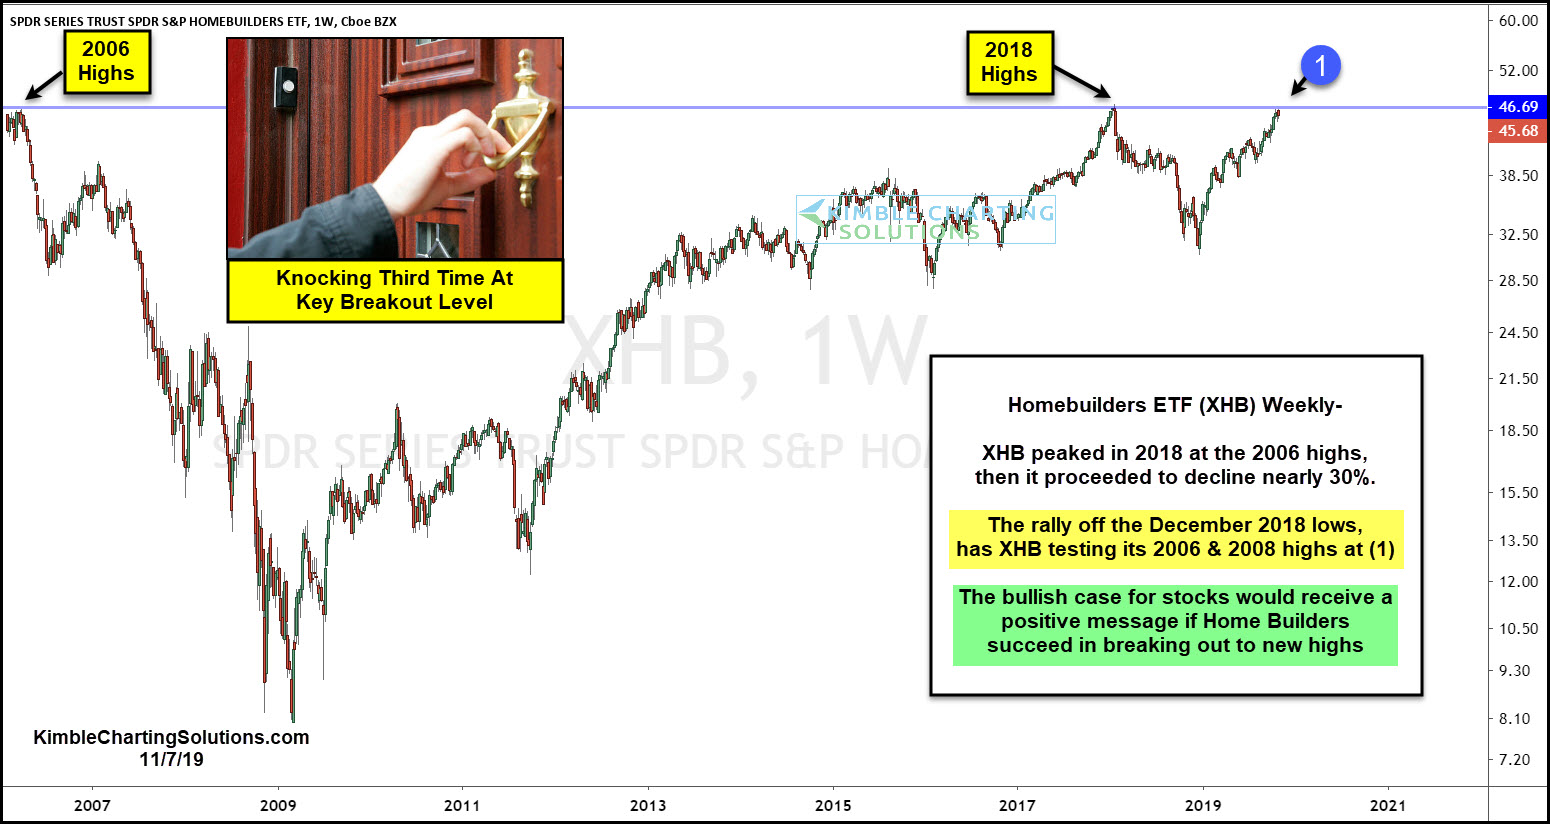
This chart looks at Homebuilders ETF (XHB) over the past 13-years.
XHB peaked in 2016, almost a year before the broad market started feeling the impact of the upcoming financial crisis.
XHB’s rally off the 2009 lows saw it test the 2006 highs again in 2018 before it declined nearly 30%; as a breakout attempt was unsuccessful.
XHB’s rally off the December 2018 lows, has it testing its 2006 and 2018 highs again at (1).
Will XHB breakout or peak again at prior highs? What it does at (2), should send an important message to the broad market!
Disclosure: Sign up for Chris's Kimble Charting Solutions' email alerts--click here.
How did you like this article? Let us know so we can better customize your reading experience.

Comments
Leave a comment to automatically be entered into
our contest to win a free Echo Show.

