
Historical Analog For Gold Stocks
When I updated my book late last year (which you can get at my website for free), I changed my view of the big picture outlook and the best historical comparison for precious metals.
From both an economic and macro-market perspective, everything points to the early 1960s.
This was a period of low-interest rates, low statistical inflation, and a booming stock market that eventually gave way to a secular upturn in interest rates and inflation and by the late 1960s, a secular bear market in financial assets.
The Gold price was fixed, but that did not stop the gold mining stocks. They began a substantial secular upturn in 1957 and enjoyed tremendous (like a KWN interview) performance, specifically from 1960 to 1967.
Concerning the stock market, the 1960s is the best comparison to today because that was the only other period that followed a secular breakout, but while the market was richly valued by the Shiller PE (CAPE). In the chart below, we plot the S&P 500 and its CAPE ratio.
(BO means breakout and VP means valuation peak.)
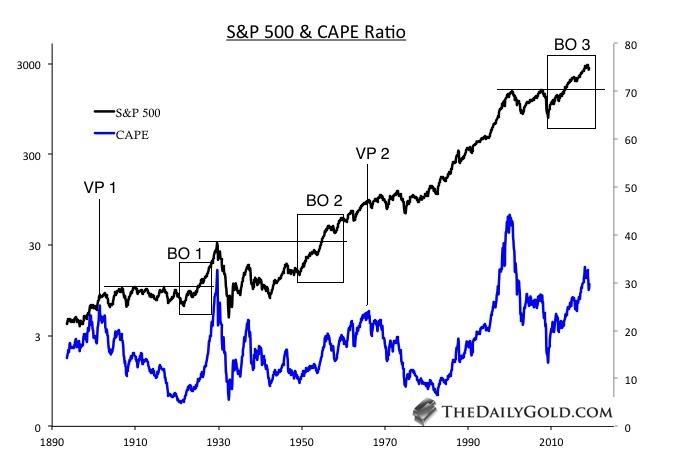
S&P 500 & CAPE Ratio (10-Year PE)
Stocks remained in a secular bull market in the early 1960s despite meager expected returns.
We have the same situation today, and that is also true of Bonds.
The chart below shows expected returns from a 60/40 portfolio, which is 60% in stocks and 40% in Bonds. Note that the three worst times to be invested in the 60/40 portfolio were 1957, 1999, and 2016.
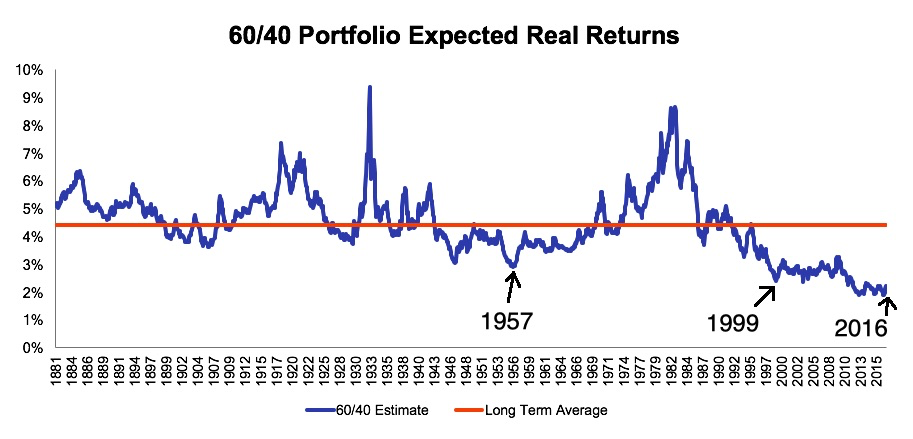
Expected Return 60/40 Portfolio
Turning to the gold stocks, we find that the best buying opportunities from a secular standpoint were in 1957 and 2000. Time will tell, but we firmly believe we can add 2016 to that list.

S&P TSX Gold & Rolling Returns
If you need more evidence, then take a look at this next chart, which plots the two historical gold stock indices against the S&P 500.
Relative to the stock market, the gold stocks were their cheapest ever around 1960 and in 2000. That is in addition to 2016 and 2018.

Gold Stocks vs. S&P 500
Ultimately, over the coming years and decades, precious metals and gold stocks especially will enjoy excellent returns. The major inflation cycle that will turbo-charge performance has barely begun and won’t even peak until the late 2030s.
The following analog chart gives a bird’s eye view of the potential for gold stocks over the years ahead.
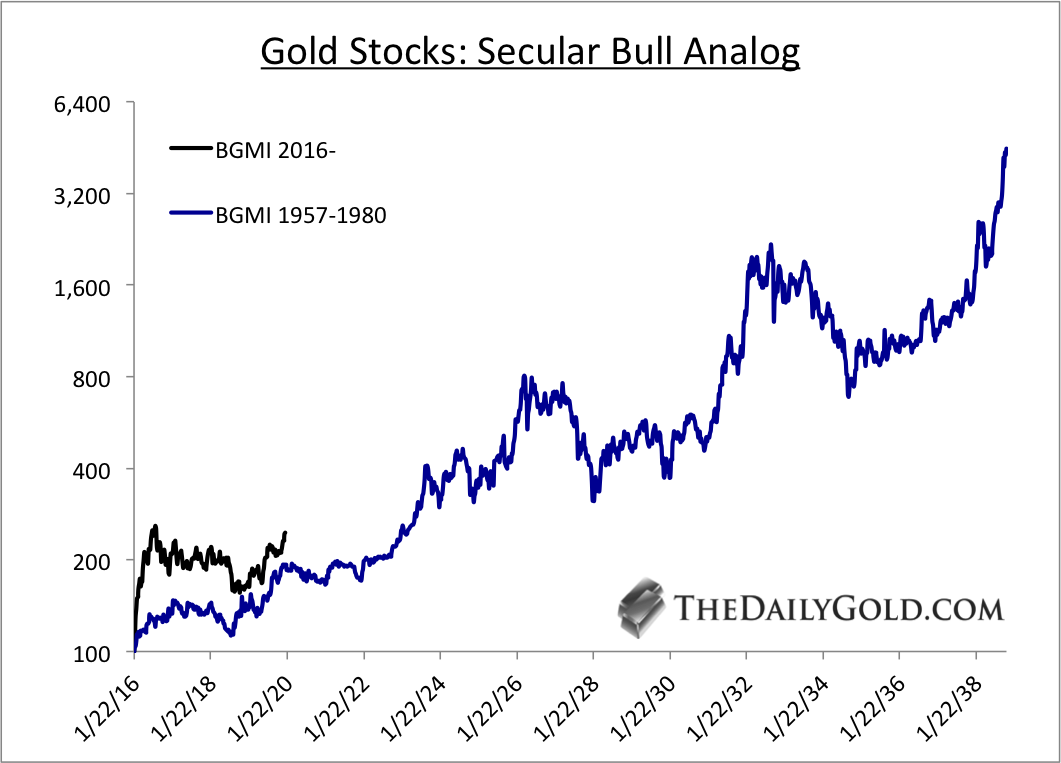
With all that said, gold stocks are volatile and the climb higher will endure corrections and downturns.
As we’ve noted, the gold stocks have an excellent setup that could lead to a huge move higher over the next 12 months. However, at present, the short-term technicals are iffy, the sentiment is too bullish, and there isn’t an immediate fundamental catalyst.
Temper your expectations for the time being and look to buy weakness if we see the gold stocks heading for their 200-day moving averages.
Disclaimer: The information, facts, figures, data, and analysis included in our publications are believed to be accurate, reliable and credible but nothing has been independently verified for ...
more

