Historic Strength Out Of Philly
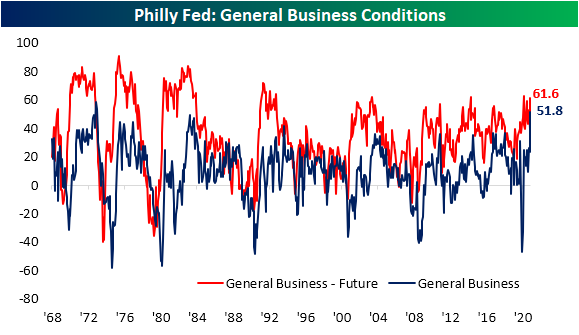
It’s hard to get a report much stronger than this morning’s release of the Philadelphia Fed’s Manufacturing Report. The report showed the region’s manufacturing economy expanded rapidly in March across categories with similarly strong optimism with regards to the future. The headline number was expected to see only a 0.9 point increase from last month’s reading of 23.1. Instead, it more than doubled, leaping 28.7 points versus February’s reading. That is the largest one-month gain since the record 57.6 point increase in June of last year. Other than that, only September and October of 1980 have seen larger monthly moves in the data going back to 1968. Not only was the size of the move large, but at 51.8, the index reached the third-highest level on record behind March (58.5) and April (53.6) of 1973. Similarly, while not at the same sort of historic high, the expectations component of this month’s report also experienced a massive uptick that ranks in the top 1% of all monthly moves.

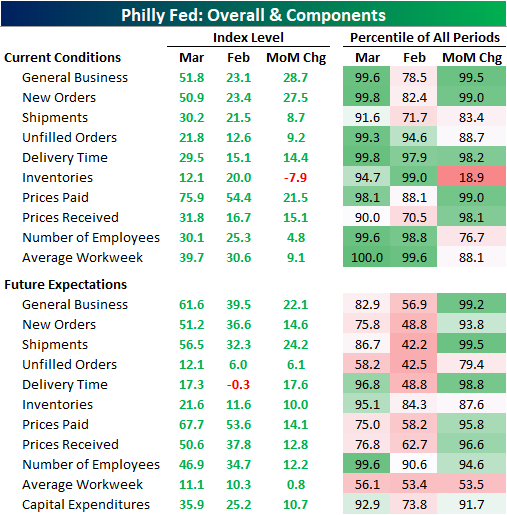
Given that strength in general business activity, it should come as no surprise that every index for current conditions came in the top decile of all readings with the same applying to some of the month over month moves. As for the indices regarding future expectations, the current levels are more modest relative to their historic ranges with only those for Delivery Times, Inventories, Number of Employees, and Capital Expenditures notably elevated. Like the current conditions indices, though, many of these saw moves that stand around the top 5% of all periods or better.

Demand was certainly a bright spot in this month’s report. The New Orders Index rose 27.5 points to the second-highest level on record. As the index for General Business Activity, the only time that the New Orders Index was higher was back in March 1973. While the one-month gain still stands in the top 1% of all monthly moves, there was actually a larger increase just two months ago when the index rose 28.1 points. Given the rapid acceleration in New Orders, Unfilled Orders also has risen sharply and has only been higher four other times. The most recent of these was back in January, but once again, prior to that, you would need to go all the way back to 1973 or earlier for readings as high as now.
Considering the high level in new and unfilled orders, the reading in the Shipments Index was perhaps a bit more modest. In fact, the spread between the indices for Shipments and New Orders was at a record low in March. Although it is still at very healthy levels in the top 10% of all periods, at 30.5, the Shipments Index actually saw a stronger reading as recently as October. One potential factor in the difference between the growth in orders and products actually getting out the door could be related to supply chain disruptions. Higher readings in the Delivery Time Index indicate longer lead times. This month, the index rose up to 29.5 which is only a half-point below the record high in January. Meanwhile, the Inventories Index fell to the lowest level in four months.
(Click on image to enlarge)

As a result of all of this, prices (particularly prices paid) continue to accelerate at a rapid pace. The Philly Fed noted that over 77% of the responding firms to the survey reported higher input prices compared to 55% last month. That lead the Prices Paid Index to increase 21.5 points to 75.9; a level that has not been observed since early 1980. Expectations are also on the rise but are more toned down as that index rose 14.1 points to the highest level since only April 2018.
As for Prices Received, things are tamer albeit, at 31.8, this index is also at historically strong levels. While that is still several points below the higher level of 36.6 from two months ago, the last time readings above 30 were observed was back in the spring and summer of 2018.

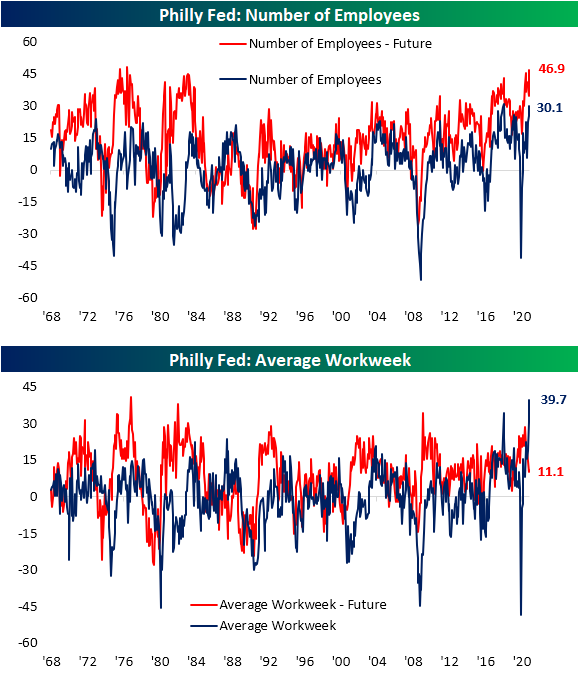
Today’s report also showed some very interesting trends concerning the labor market. The index for the Number of Employees rose to 30.1. The only time that it was higher was in May and June of 2018. The region’s firms also appear to want to continue to increase hiring down the road as the index for expectations reached 46.9. That is one of the highest levels on record with the last time such a level was reached being 1976. Even though firms are reporting more employees, the Average Workweek is skyrocketing. Last month, that index had reached 30.6 which was the second-highest reading on record. Fast forward to this month, the March print left both last month and the previous record of 34.2 from May 2018 in the dust. That increase in the average workweek is likely a result of firms doing more with less labor as they can’t fill certain positions. The special questions asked in the survey shed some additional light on this as 64.3% of companies reported labor shortages and 44.6% of job vacancies have been open for 3 or more months.

Click here to view Bespoke’s premium membership options for our best research ...
more


