
Historic Data Points To Strong Gains For S&P 500 In 2021
Welcome to Finom Group's weekly data Mash-up at February's month-end. With a few days left in the trading month, the S&P 500 has grappled back all it had lost in January and then some. While the benchmark index seems in need of a rest and breadth has weakened over the previous trading days, last Friday's decline held some hidden secrets underneath the hood of the index. With that said, let's review some recent historical data and technicals in order to understand the probable outcomes for the S&P 500 going forward!

- A 10% or more gain in the final 2 months of the year has equaled a higher S&P 500 the following year every single time since World War II.
- This just happened in 2020 folks!
- Additionally, January was higher every single time, until 2021! (Chart from LPL Financial)
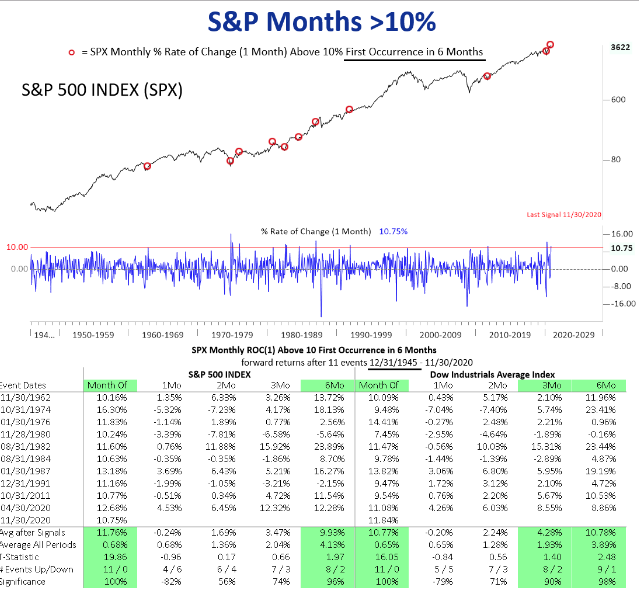
- This study above from Nautilus Research identifies when the S&P 500 has gained 10%+ within 6 Months of the last occurrence since WW2. In other words, when it happens twice within close proximity.
- The last occurrence was November 2020. 1-month return is actually negative, but December 2020 held a positive return.
- January, or the 2-month return, had a little of 50% positivity rate and an average return of 1.6%. January 2020 was negative.
- The 3-month return would be February 2020 and has an average return of 3.47% and a positivity rate of 74%. February 2021 to-date is up more than 5%.
- The VIX spiked 62% higher on January 27, the 3rd largest 1-day % increase in history.
- VIX data goes back to 1990).
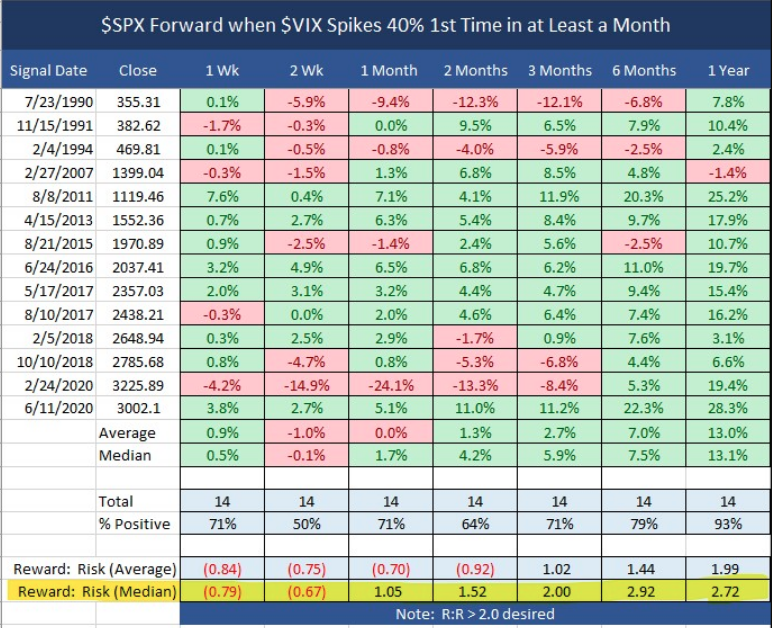
- When VIX Spikes 40% for the first time in at least a month, the SPX Reward to Risk is suboptimal (below 2) for the next few months.
- February 2020 is materially outperforming the historic data thus far.
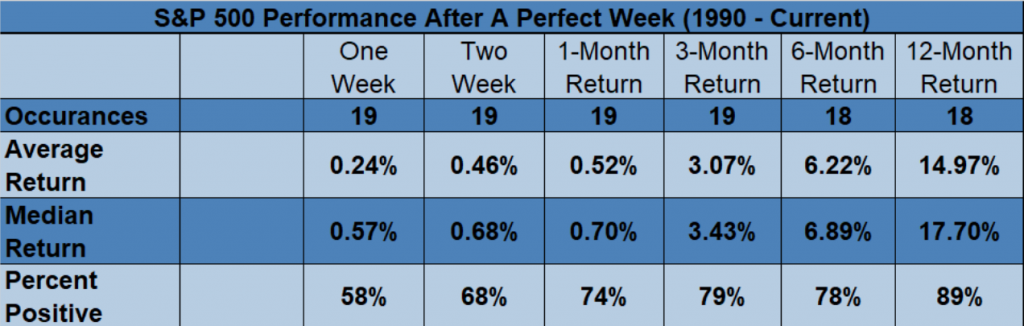
- The first week of February, the S&P 500 was green all 5 days and finished at an all-time high.
- This was the 20th perfect week like that since 1990.
- Returns out 6 months seem about average, but a year later stocks are higher 89% of the time and up 15% on average.
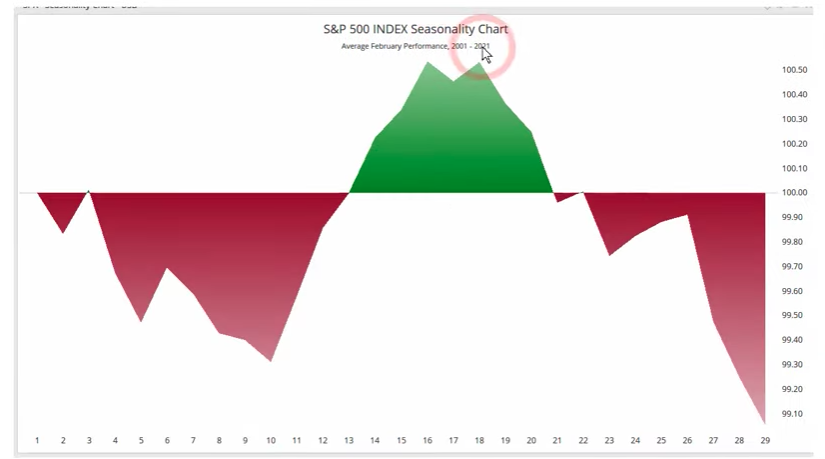
- In the chart above, if just go back to 2001, we can see that the majority of the time the month of February is a down month.
- We can also look at post-election February performances.
- Keep in mind that post-election for January we typically see the monthly performance positive, but that didn’t happen this past January.
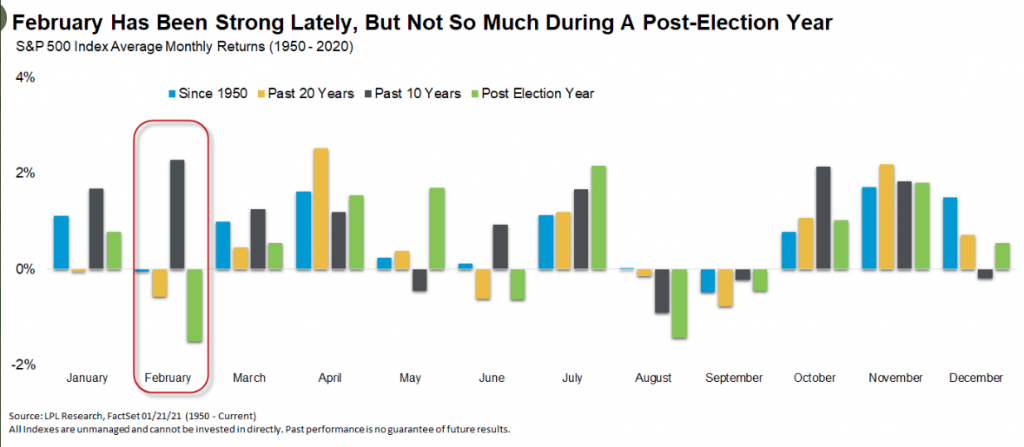
- Historically, February isn’t usually a great month.
- February is the best month of the year over the past decade, up both post-election years (2013 and 2017)
- February 2001: -9.23 2002: -2.08 2003: -1.7 2004: 1.22+ 2005: 1.89+ 2006: .05+ 2007: -2.18 2008: -3.48 2009: -10.99 2010: 2.85+ 2011: 3.2+ 2012: 4.06+ 2013: 1.11+ 2014: 4.3+ 2015: 5.49+ 2016: -.41 2017: 3.72+ 2018: -3.89 2019: 2.97+ 2020: -8.4
- The Valentine’s Day Indicator: Average return since 1950 for S&P 500 from 2/14 until the end of year is 7.5%.
- BUT… if up >4% YTD on 2/14, it jumps up to 13% the rest of year.
- The S&P 500 finished up 5.3% YTD as of Friday and the last trading day before Valentine’s Day.
- The S&P 500 has had 2 consecutive double-digit annual returns. This is yet another piece of historic data pointed in favor of double-digit returns.
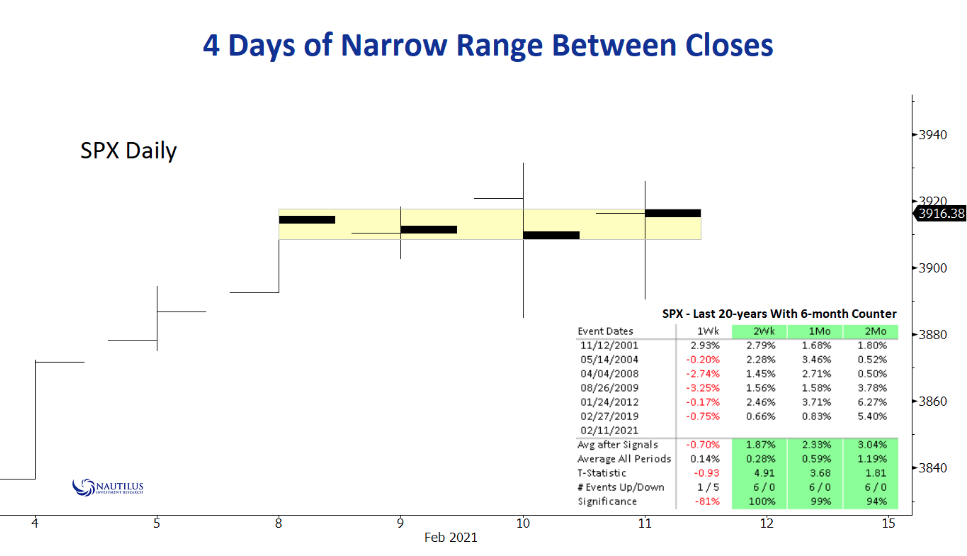
- 2 weeks ago, one of the issues discussed in the Finom Group Trading Room was the very narrow trading range the market traded in from Monday through Thursday. It wreaked of a market suggesting near-term exhaustion and or demanding a catalyst to continue higher. I e-mailed a colleague at Nautilus Research to see if there was anything to glean from such narrow trading ranges, based on one closing day price to the next. The above study is what he found.
- The next week after such a narrow trading range over a 4-day span, the market was largely in the red, on average -70% return. Last week, the S&P 500 was down .71%.
- The exhaustion thesis was correct.
- Having said that, the forward 2-week, 1-month, and 2-month returns are attractive based on the study.
- This coming week will be week 2.
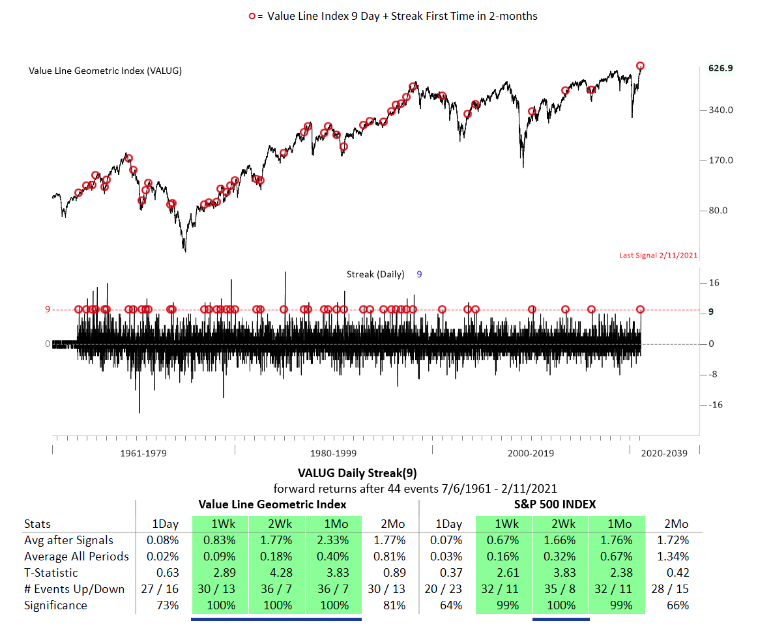
- This particular study based on a 9-day win streak in the VALUG has happened 44 times in the past and has produced reasonable gains with a near 100% positivity rate going out one month.
- The 1-week return average with a 99% positivity rate did not happen last week. The first disappointment for this signal.
- Nonetheless, the 2-week return has never failed and offers an average S&P 500 return of 1.66%, and holds a 100% positivity rate.
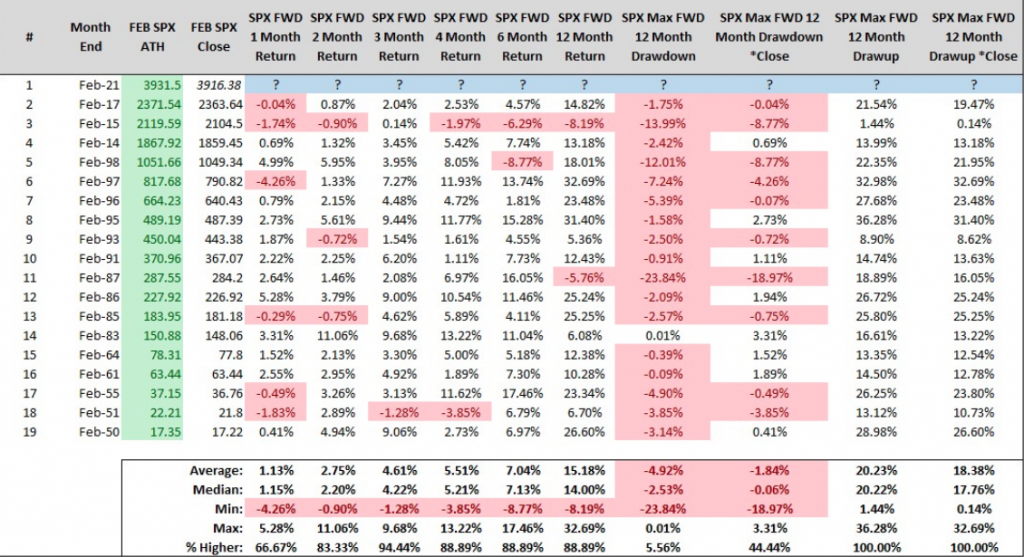
- The study from Steve Deppe informs investors as to what happens going forward when the S&P 500 sets a new all-time high in the month of February.
- Study offered on February 12th.
- The good news, as I usually look at the positivity %age first, is that after the 1-month period all other time periods have a positivity %age rate above 80 percent! The average and median returns increase further out the time period.
- But here is the real challenge for the S&P 500 this coming week according to Deppe...
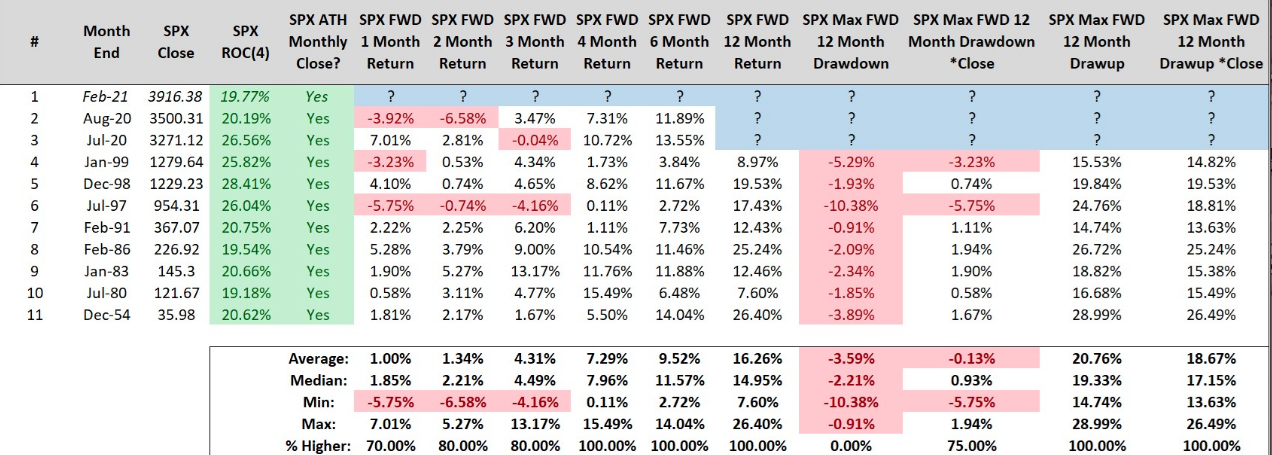
- If February can close >=3890 the S&P 500 will have gained 19% or more the last 4 months & closed at a new all-time high.
- It's always continued. Look at the positivity rate for the 1,2,3,4,6 and 12-month returns!
- The trend has been supported and validated by strong breadth and sector rotations in perpetuity.
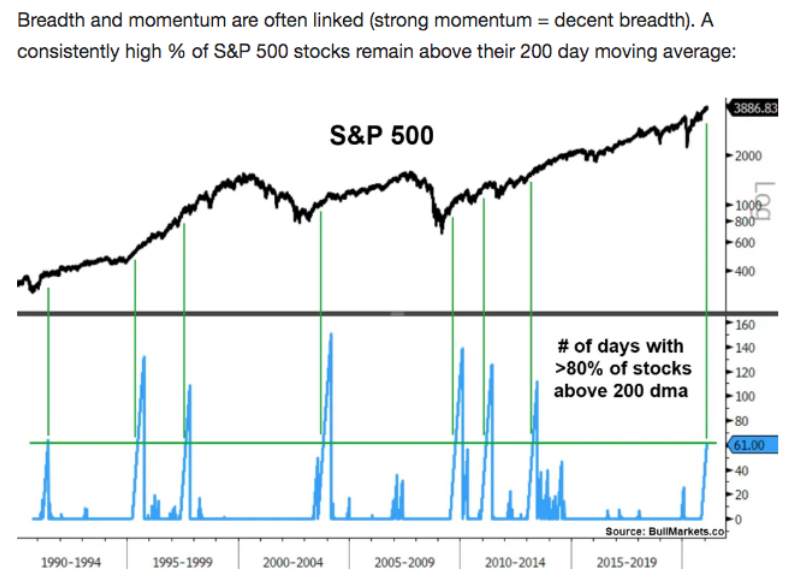
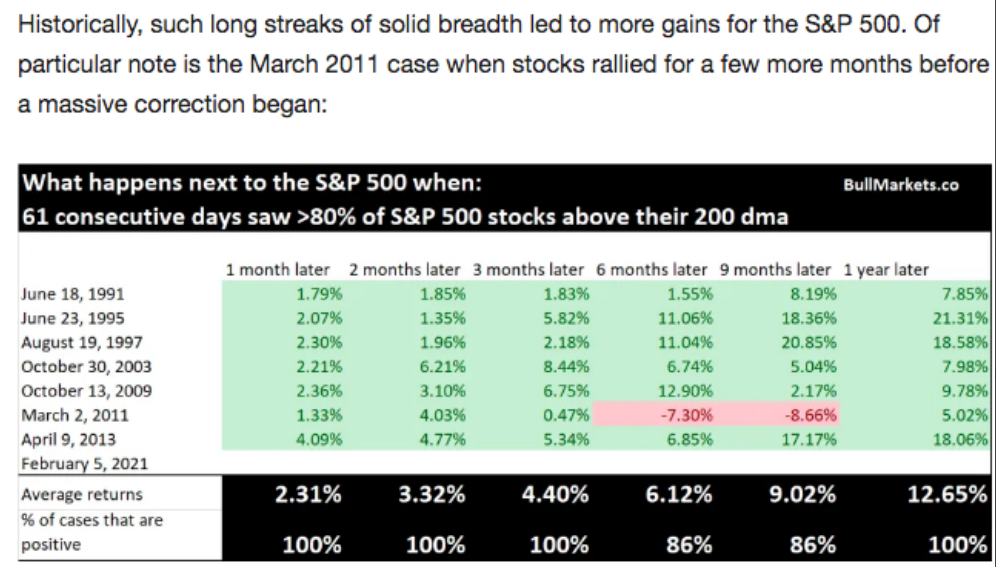
- Having said that, let’s look at what breadth may identify in the way of forward-looking returns in the latest study/data from Troy Bombardia, but this time by way of the S&P 500.
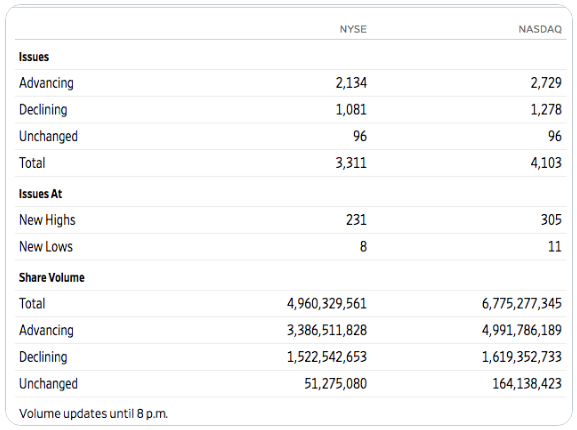
In closing, while the major averages fell last week, and most major averages were down on Friday with monthly options expiration taking place, Friday's breadth was particularly strong. Take a look at the end of day NYSE and Nasdaq A/D issues and volume performance:
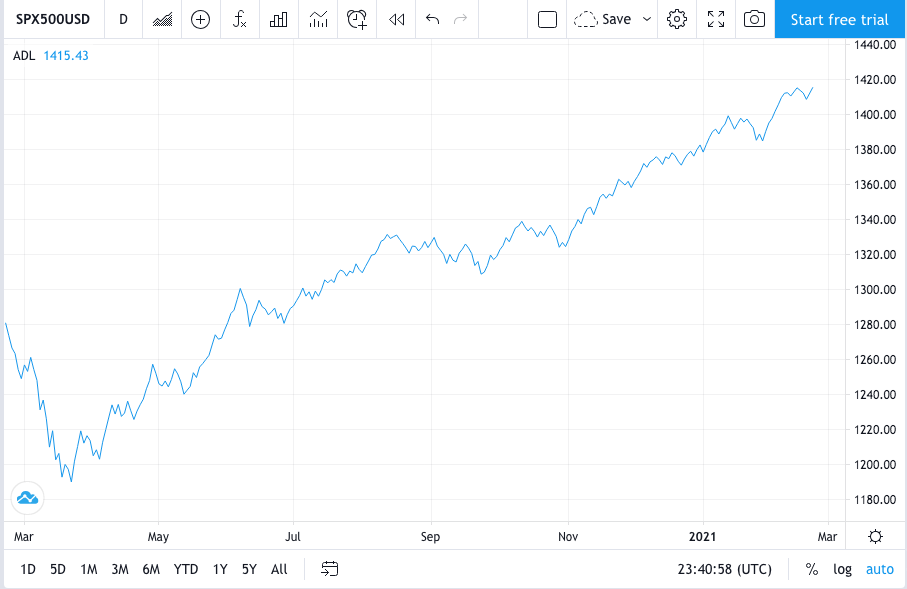
And if that wasn't enough to tantalize while everyone is seemingly calling for a 10-15% correction, fretting over rising yields, and generally preaching the Warren Buffett Indicator, take a look at Friday's S&P 500 Cumulative A/D line performance. (SPX A/D chart below)
As we know, breadth tends to lead price. The above historical data aids in offering market probabilities going forward. While the data offers no guarantees and history doesn't always repeat, it often rhymes. The more often investors are found aligning with the historic data, the more often returns can prove repeatable. Last, but certainly not least, the best friend for the average investor is time. Always listen to Seth ;-)
Disclaimer: The risk of loss in stock, stock/options, futures, futures/options, and forex trading is substantial, and site visitors and subscribers should consider whether trading these markets ...
more

