
High Yield Spreads Come Unhinged
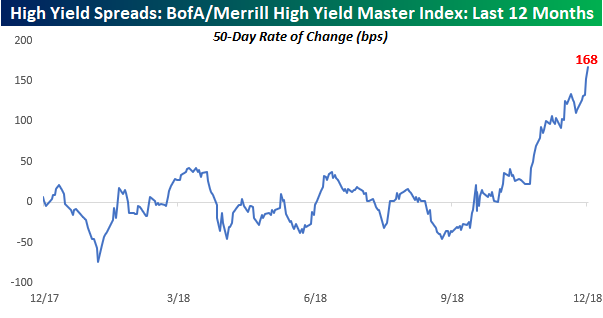
As equity prices have cratered in the last several trading days, one area of the market that has predictably come under selling pressure is high yield credit. The chart below shows the 50-day rate of change in spreads on high yield bonds relative to treasuries. When spreads are rising, it indicates that investors are becoming more risk-averse and demanding higher payment in the form of higher interest rates on riskier credit. As risk aversion fades, the opposite is the case as investors demand less in the form of interest payments causing spreads to decline.
A look at how credit spreads have changed over the course of the last year certainly supports the meltdown we have seen in equity prices. Over the last 50 trading days, spreads on high yield debt have increased by 168 basis points (bps), which is a seismic shift relative to the range of the last 12 months. Prior to this recent move, spreads never widened by more than 50 bps over the prior year.
(Click on image to enlarge)
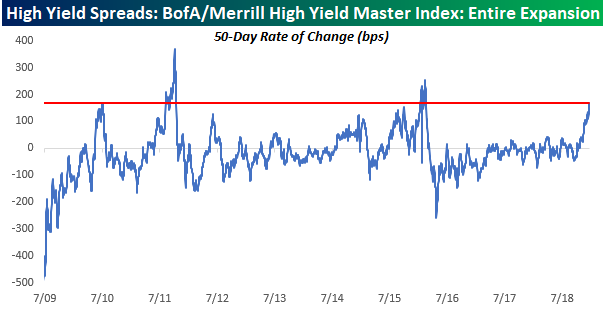
While the move in spreads looks seismic over the short-term, we would note that there have been three other periods during this current economic expansion where we saw spreads widen by as much or even more than they have over the last 50 trading days. To be sure, each one of those periods saw messy markets and/or a slowdown in the US economy, but they didn’t market the end of the expansion either. Things could change from here and easily get worse, but at this point, the move we have seen in high yield spreads over the last few months are not unprecedented.
(Click on image to enlarge)
Disclaimer: To begin receiving both our technical and fundamental analysis of the natural gas market on a daily basis, and view our various models breaking down weather by natural gas demand ...
more

