
Herd Behavior
"Herd behavior, or the tendency of individuals in a group to 'follow the trend,' has frequently been observed in equity markets. Herd behavior in investors leads to a convergence of action." [Yan, Zhao, Sun (2012)]
"Theoretical models on herd behavior predict that under different assumptions, herding can bring prices away (or towards) fundamentals and reduce (or enhance) market efficiency." [Yan, Zhao, Sun (2019)]

For anyone still shaking their head over the recent eye-popping, one-way trends in the stock market, the academic assessments of "herd behavior" above may provide one of the best summations I've seen.
Or, if you prefer something a little more pop culture oriented, there is Eddie Vedder's view on the subject from the 1996 Pearl Jam hit Do The Evolution... "I'm the man buying stocks on the day of the crash... It's herd behavior, uh huh, it's evolution, baby." (P.S. If you are looking for a little kick-start to your day, this video will definitely do the trick.)
Blame It On The Computers?
To be clear, I have never been involved with a high-speed or high-frequency trading shop. As such, I have to admit that I do not know all the ins and outs of how today's algorithmic trading programs function - or even what triggers them. However, I have done a fair amount of research on the subject and as such, I am pretty confident that algo-induced herd behavior had a hand in both the slow-motion crash that occurred between 12/4 and 12/24 and the ensuing joyride to the upside that began on 12/26.
I know, I know. We can't blame everything on the computers. And yes, there were definitely "issues" that traders and investors had to sort through/deal with in December. Not the least of which was the fear that a policy misstep from Powell & Co. was unfolding before their very eyes. But the bottom line is that the computer algorithms were the herd this time around.
You're Fired!
Lest we forget, the President had a hand in the problem as he appeared to channel his best "Apprentice" act relating to his desire/ability to "fire" the Fed Chair. In short, this put the FOMC in a bit of a spot. While the data - especially the "soft data" and almost anything related to inflation pressures - was clearly weakening, the new Chairman most definitely could not appear to kowtow to politics.
I think it is safe to say that it was the Fed's need to publicly display its independence from the White House that caused Powell to appear more hawkish than anticipated in December. And from my seat, it was the hawkish stance and the use of words such as "autopilot" that seemed to indicate that a Fed-induced recession might suddenly be a reality. A reality that needed to be priced into stock prices.
The New Herd
In any event, the S&P 500 proceeded to plunge -11.3% in the 6.5 sessions between 12/13 and 12/24. Call it a "bad news panic," a "waterfall decline, or an "emotional flush," but the end result was one of the finest displays of computerized "herd behavior" ever witnessed.
Then Mr. Powell had a change of heart, and words like "patient" began to be used publicly by Fed officials. Maybe it was the daily 2% declines in the major stock market indices, the plunge in bond yields, or the sudden realization that inflation pressures had dried up almost completely. But suddenly, the Fed was on pause. The balance sheet runoff was up for discussion. Data dependence was back to the fore. And a gaggle of Fed officials tried to convey a "prudent" way forward whenever/wherever possible.
To say that the new stance/tone from FOMC members was well received by the markets is an understatement. An upside "whoosh" began in response, once again displaying the power of the herd.
Maybe I'm wrong. Maybe John Q. Public was busy moving money around in their 401K accounts every day in late December due to the new market narrative. Maybe the "Soccer Mom's" got collectively short. And maybe, just maybe, the entire world is now the "fast money," all of whom, by the way, traded both the vicious decline and explosion to the upside correctly - just ask 'em.
My point on this fine Monday morning is that computerized "herd behavior" isn't likely to go away anytime soon - especially when things get dicey in the markets. As such, one needs to have a plan to deal with these one-way moves.
Will The Historic Run Continue?
On that note, the next logical question is, will the current one-way upside trend continue? After all, the S&P 500 is up +15.1% in 26 days, which certainly qualifies as a positive "thrust" for the index. And as we've detailed a time or two over the years, this type of "thrust" event tends to bode well for the bulls going forward.
For example, since 1980, six months after what is called a Double 10:1 Up Day signal (two sessions in which advancing volume exceeds declining volume by 10 to 1 or more without an intervening 10:1 "Down Day"), the S&P 500 has been higher 85.7% of the time, by an average of 11.8%. (Source: Ned Davis Research). For the record, the latest Double 10:1 signal occurred on 1/4/19.
Yet at the same time, there is certainly a limit to how much a market can move in a short period of time, right? To be sure, +15% in 5 weeks is a big pop and stocks are now overbought. So, can we really expect stocks to simply dance merrily to new highs from here?
Short answer; probably not right here, right now.
Let's remember that stocks were down about 10% before the mid-December freak-out really got rolling. My thinking is that at least some of that decline was in recognition of the fact that both economic and earnings growth is slowing. An issue that has most definitely not gone away.
There is also the pesky little fact that the big bounces that typically follow waterfall declines tend to succumb to at least one retest phase. Generally speaking, the retest phase occurs as the initial reason for the decline resurfaces after the big bounce off the emotional low has run its course.
For example, despite the impressive track record of gains six months after a Double 10:1 Up Day signal has been given, NDR computers tell us that the S&P 500 has closed BELOW the price where the signal was given a whopping 80% of the time. In this case, this would mean a close below the 1/4/19 close on the S&P 500 of 2531.94.
P.S. The average decline for the "retest pullback" after a Double 10:1 Up Day signal has been -4.3%, which from Friday's close would be 2590, while the worst "retest pullback" was 8.1%, which would put the S&P at 2468.
Near-Term Game Plan
Unless both economic and earnings growth is going to consistently surprise to the upside going forward, some backing and filling would appear to be in order at some point in the near future. And unless/until something big happens to change the herd's narrative yet again, the history of waterfall/emotional lows and "thrust" buy signals reminds us that buying the next dip is a strong way to play going forward. Well, as soon as the herd gets done celebrating the jobs report and the expected China deal, that is.
Weekly Market Model Review
Now let's turn to the weekly review of my favorite indicators and market models...
The State of the Big-Picture Market Models
I like to start each week with a review of the state of my favorite big-picture market models, which are designed to help me determine which team is in control of the primary trend.

The Bottom Line:
- The narrative and the market environment continue to change quickly. This is illustrated by the rapid changes seen on the Primary Cycle board. For the fifth week in a row, there are important changes - this time it's one to the upside and one to the downside. On the positive front, the Risk/Reward Model flashed a buy signal and moved up into the positive zone, reversing a sell signal that had given us fair warning that all was not right with the indicator world back in February 2018. On the negative side, my "Desert Island" model slipped to a sell and into the red. However, the reading is not convincing and is a response to overbought conditions. But the bottom line here is clear: The board leaves a lot to be desired.
This week's mean percentage score of my 6 favorite models improved to 48.9% from 47.8% (2 weeks ago: 41.9%, 3 weeks ago: 46.1%, 4 weeks ago: 40.3%) while the median rose to 46.7% from 45% (2 weeks ago: 40%, 3 weeks ago: 55%, 4 weeks ago: 50%).
The State of the Trend
Once I've reviewed the big picture, I then turn to the "state of the trend." These indicators are designed to give us a feel for the overall health of the current short- and intermediate-term trend models.
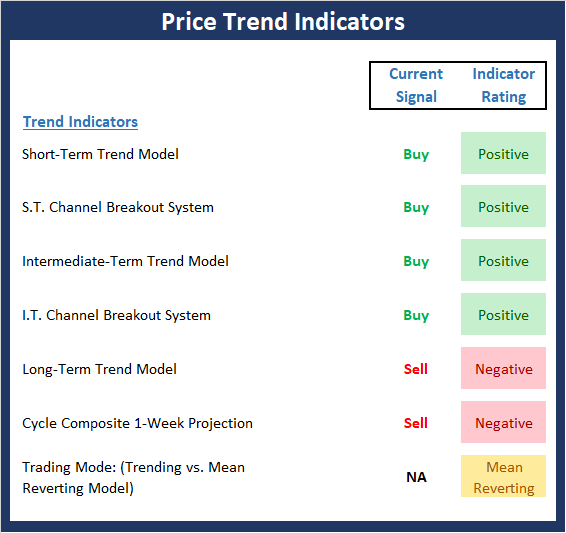
The Bottom Line:
- The bulls continue to assert themselves last week, flipping both the short- and intermediate-term channel breakout systems positive. However, the cycle composite calls for a pause in the action and given the overbought nature of the market and the overhead resistance represented by the seemingly important 200-day moving average, logic dictates that the bulls could take a break soon.
The State of Internal Momentum
Next up are the momentum indicators, which are designed to tell us whether there is any "oomph" behind the current trend.

The Bottom Line:
- The fact that the Momentum board is awash in green this week is an excellent indication that the recent rally, which has gained more than 15% in just 5 weeks, has some intensity behind it. This may be due to the abrupt change in the Fed's policy or the increasing hopes for a trade deal with China. But in any event, the momentum favors the bulls and suggests a buy-the-dip environment has returned.
The State of the "Trade"
We also focus each week on the "early warning" board, which is designed to indicate when traders might start to "go the other way" -- for a trade.
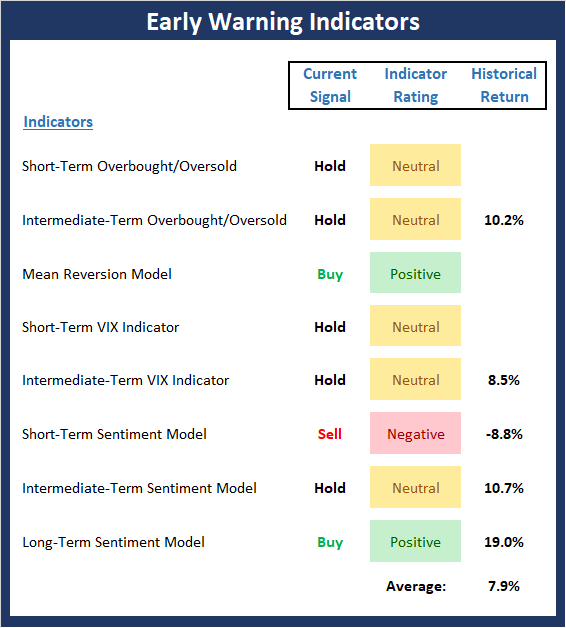
The Bottom Line:
- Stocks remain overbought from both a short- and intermediate-term perspective. And while the board isn't flashing a lot of red, it is important to note that it is VERY close to doing just that. As I have written for the past two weeks, almost any decline will trigger a sell signal from our s.t. overbought/sold model as well as both VIX models. The bottom line remains the same; stocks are ripe for a pullback.
The State of the Macro Picture
Now let's move on to the market's fundamental factors - the indicators designed to tell us the state of the big-picture market drivers including monetary conditions, the economy, inflation, and valuations.
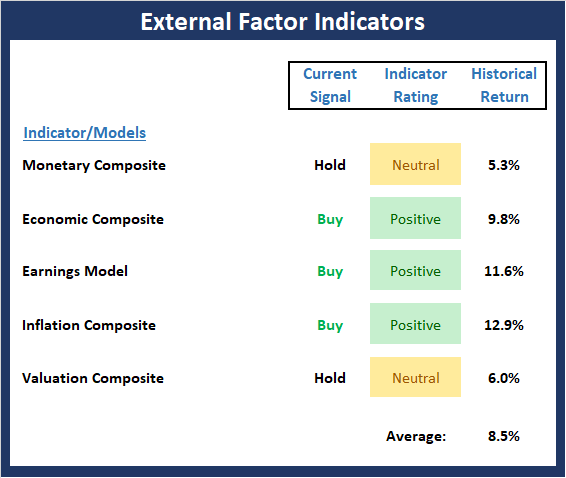
The Bottom Line:
- Despite all the talk about #GrowthSlowing, the fact that the economic growth rate is still above the recent trend, that rates have pulled back, that earnings continue to advance, that inflation pressures have fallen, and that valuations have improved combine to suggest that the external backdrop for the stock market looks fairly solid.
Disclosure: At the time of publication, Mr. Moenning held long positions in the following securities mentioned: none - Note that positions may change at any time.
The opinions and forecasts ...
more

