
Health Care Sector
The Health Care sector ranks sixth out of the ten sectors as detailed in my Sector Rankings for ETFs and Mutual Funds report. It gets my Neutral rating, which is based on aggregation of ratings of 22 ETFs and 82 mutual funds in the Health Care sector as of July 14, 2014. Prior reports on the best & worst ETFs and mutual funds in every sector are here.
Figures 1 and 2 show the five best and worst-rated ETFs and mutual funds in the sector. Not all Health Care sector ETFs and mutual funds are created the same. The number of holdings varies widely (from 20 to 310). This variation creates drastically different investment implications and, therefore, ratings. The best ETFs and mutual funds allocate more value to Attractive-or-better-rated stocks than the worst ETFs and mutual funds, which allocate too much value to Neutral-or-worse-rated stocks.
To identify the best and avoid the worst ETFs and mutual funds within the Health Care sector, investors need a predictive rating based on (1) the stocks ratings of the holdings, (2) the all-in expenses of each ETF and mutual fund, and (3) the fund’s rank compared to all other ETFs and mutual funds. As a result, only the cheapest funds with the best holdings receive Attractive or better ratings. Investors need not rely on backward-looking ratings. My fund rating methodology is detailed here.
Investors seeking exposure to the Health Care sector should buy one of the Attractive-or-better rated ETFs or mutual funds from Figures 1 and 2.
Get my ratings on all ETFs and mutual funds in this sector on my mutual fund and ETF screener.
Figure 1: ETFs with the Best & Worst Ratings – Top 5
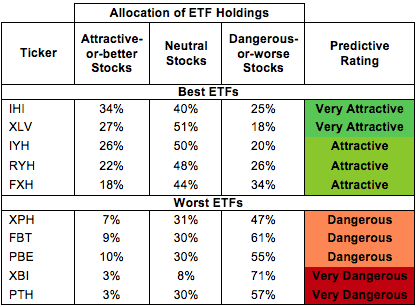
* Best ETFs exclude ETFs with TNAs less than $100 million for inadequate liquidity.
Sources: New Constructs, LLC and company filings
Figure 2: Mutual Funds with the Best & Worst Ratings – Top 5
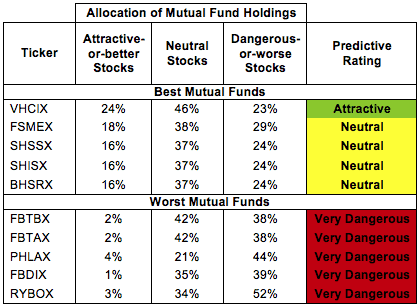
* Best mutual funds exclude funds with TNAs less than $100 million for inadequate liquidity.
Sources: New Constructs, LLC and company filings
Oak Associates Live Oak Health Sciences Fund (LOGSX) and Saratoga Advantage Trust: Health and Biotechnology Portfolio (SBHIX) are excluded from Figure 2 because their total net assets (TNA) are below $100 million and do not meet our liquidity minimums.
iShares Dow Jones U.S. Medical Devices Index Fund (IHI) is my top-rated Health Care ETF and Vanguard Health Care Index (VHCIX) is my top-rated Health Care mutual fund. IHI earns my Very Attractive rating and VHCIX earns my Attractive rating.
PowerShares DWA Healthcare Momentum Portfolio (PTH) is my worst-rated Health Care ETF and Rydex Series Biotechnology Fund (RYBOX) is my worst-rated Health Care mutual fund. Both earn my Very Dangerous rating.
Figure 3 shows that 23 out of the 318 stocks (over 17% of the market value) in Health Care ETFs and mutual funds get an Attractive-or-better rating. However, while 8 out of 22 Health Care ETFs (over 60% of total net assets) receive an Attractive-or-better rating, only 4 out of 82 Health Care mutual funds (less than 2% of total net assets) get an Attractive-or-better rating.
The takeaway is: Mutual fund managers allocate too much capital to low-quality stocks.
Figure 3: Health Care Sector Landscape For ETFs, Mutual Funds & Stocks
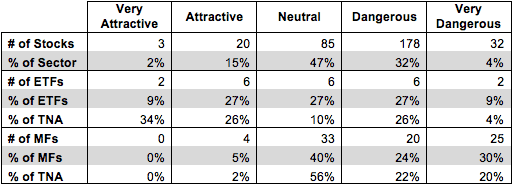
Sources: New Constructs, LLC and company filings
As detailed in “Cheap Funds Dupe Investors”, the fund industry offers many cheap funds but very few funds with high-quality stocks, or with what I call good portfolio management.
Investors need to tread carefully when considering Health Care ETFs and mutual funds. Only 8 ETFs and 4 Health Care mutual funds in the Health Care sector allocate enough value to Attractive-or-better-rated stocks to earn an Attractive rating.
Eli Lilly (LLY) is one of my favorite stocks held by Health Care ETFs and mutual funds and earns my Very Attractive rating. Since 2004, LLY has grown after-tax profits (NOPAT) by 8% compounded annually. The company currently earns a return on invested capital (ROIC) of 16%, which puts it in the top quintile of all the companies I cover. LLY has also generated positive economic earnings every year since 1998. While the stock is up over 23% this year, it is still attractively priced. At its current price of ~$64/share, LLY has a price to economic book value (PEBV) ratio of 0.9. This ratio implies that the market expects LLY’s NOPAT will permanently decline by 10%. This expectation seems overly pessimistic when considering LLY’s long and strong history of profit growth. Investors should pick up shares of LLY while they still trade at a discount.
Quidel Corporation (QDEL) is one of my least favorite stocks held by Health Care ETFs and mutual funds and earns my Very Dangerous rating. The company also lands on my Most Dangerous Stocks list for September. QDEL’s NOPAT of $6 million is down 21% compounded annually over the last five years. Over the same timeframe, the company’s ROIC has fallen from 25% in 2008 to 2%, which puts QDEL in the bottom quintile of all the companies I cover. The stock price has performed accordingly and fallen over 25% this year. However, even at its current price QDEL is highly overvalued. In order to justify its current price of ~$23/share, QDEL would have to grow NOPAT by 15% compounded annually for 36 years. To grow NOPAT at all would be considered great progress for QDEL. To grow at a double-digit pace for three decades is an awfully optimistic expectation.
369 stocks of the 3000+ I cover are classified as Health Care stocks.
Figures 4 and 5 show the rating landscape of all Health Care ETFs and mutual funds.
My Sector Rankings for ETFs and Mutual Funds report ranks all sectors and highlights those that offer the best investments.
Figure 4: Separating the Best ETFs From the Worst ETFs
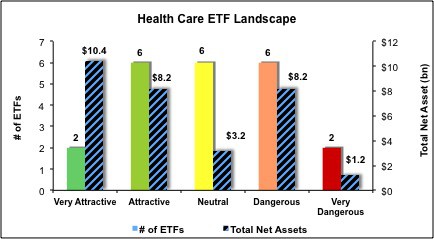
Sources: New Constructs, LLC and company filings
Figure 5: Separating the Best Mutual Funds From the Worst Mutual Funds
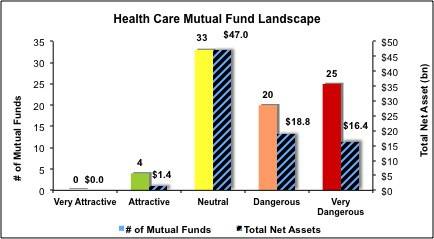
Sources: New Constructs, LLC and company filings
Review my full list of ratings and rankings along with reports on all 22 ETFs and 82 mutual funds in the Health Care sector.
Disclosure: NewConstructs staff receive no compensation to write about any specific stock, sector, or theme.


