Has Value Investing Gone Out Of Style?
Is value dead? Or do the enthusiasts of the Russell index family and the Fama-French Factor Model need to re-evaluate price-to-book ratio (P/B) as the primary metric used in defining value stocks?
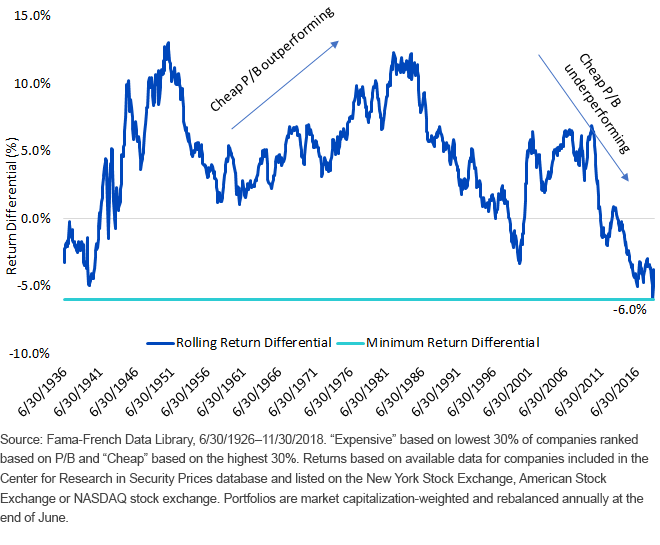
The decade ending September 2018 was the single worst decade in history for P/B as a factor-sort of the market.
Rolling 10-Year Return Differentials: Cheap vs. Expensive Price-to-Book

Deteriorating Power?
In their seminal factor paper, Fama and French wrote: “there is no evidence that its explanatory power deteriorates through time.”1
Perhaps they will consider the new evidence.
In 616 of the 679 10-year periods from 1926 through to the end of 1992, the cheap stocks outperformed the expensive stocks, with the median performance advantage greater than 500 basis points (bps) per year.
But recent returns have been trending down as we saw earlier with the recent single worst decade for low-P/B stocks compared to high-P/B stocks.
This is not just an academic exercise on the limits to valuation-oriented investing.
The Russell family of indexes, established in 1979—ahead of the Fama-French research—utilizes P/B as the primary determinant of what defines a value stock. It now has been 40 years since the creation of that index family and the Russell 1000 Value Index has outperformed the Russell 1000 Growth Index.2
But consistent with the recent downward trend in relative performance, over the past 30 years, the Russell Value has lagged the Russell 1000 Growth by 21 bps annualized, with more recent underperformance significantly greater.3
What Caused Recent Underperformance of Value?
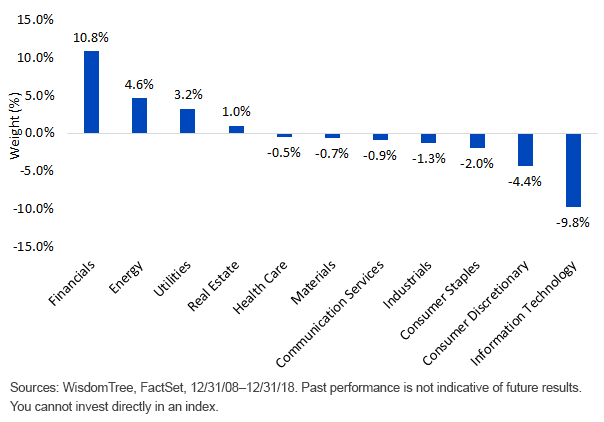
It was primarily sector tilts that caused the lagging performance for Russell Value. P/B sorting of the market as a value strategy results in chronic sector tilts, particularly toward Financial stocks and away from Technology stocks.
On average, the Russell 1000 Value Index has been overweight Financials by 11%, and underweight Information Technology by 10% over last decade. These bets are persistent and likely will continue for some time.
Russell 1000 Value Index vs. Russell 1000 Index Average Active Weights: Trailing 10-Years

A sector attribution of Russell 1000 Index performance relative to the Russell 1000 Value Index over the past decade can help dissect this performance impact.
Of the 210 bps of outperformance for the Russell 1000 Index over the Russell 1000 Value, 83 bps came from the Information Technology sector alone.
Trailing 10-Year Attribution of Russell 1000 Index vs. Russell 1000 Value Index: Information Technology and Financials

A number of market commentators believe the epic run of outperformance by growth stocks will end and that value is destined to turn around.
This may be true, but clearly the most important ingredient for that turn would be Financials outperforming Technology. How confident are you in that outcome?
WisdomTree will be coming back to this topic in 2019, particularly focusing on new value-sensitive index strategies that do not contain persistent sector biases.
1Eugene F. Fama and Kenneth R. French, “The Cross-Section of Expected Stock Returns,” The Journal of Finance, 6/1992.
2Source: WisdomTree, Zephyr StyleAdvisor, 12/31/1979-12/31/2018.
3Source: Zephyr StyleAdvisor, 12/31/1988-12/31/2018
Disclaimer: Investors should carefully consider the investment objectives, risks, charges and expenses of the Funds before investing. U.S. investors only: To obtain a prospectus containing this ...
more


