
Growth Of U.S. New Home Market Turns Negative
Following our first ever analysis of the total transaction value for existing home sales in the U.S., we're returning to more familiar territory in calculating the equivalent market capitalization for new homes sold in the U.S., where we find that it too appears to have peaked in March 2018.
![Trailing Twelve Month Average New Home Sales Market Capitalization, Not Adjusted for Inflation [Current U.S. Dollars] and Adjusted for Inflation [Constant November 2018 U.S. Dollars], January 1976 - November 2018](https://4.bp.blogspot.com/-8lrlz3N_YcU/XFciE8aUUoI/AAAAAAAAR8c/uXwILyuEenczlvkm42DEYstUqTWw20juACLcBGAs/s1600/ttma-new-home-sales-market-capitalization-197601-thru-201811.png)
In March 2018, the trailing twelve month average of the market capitalization of new homes sold in the U.S. peaked a bit over $20.3 billion. The trailing year average market cap went on to decline to $19.9 billion in June and to rebound to a high just shy of $20.3 billion in September. It has declined sharply in the months since, falling to an initial estimate of $19.2 billion for November 2018, the most recent month for which national data is available.
These significance of these changes are easier to see when we calculate the year-over-year growth rate of our trailing twelve month average for the new home market cap. The following chart reveals that the initial estimates for November 2018 have fallen into negative territory, which suggests that the new home market is experiencing some degree of contraction.
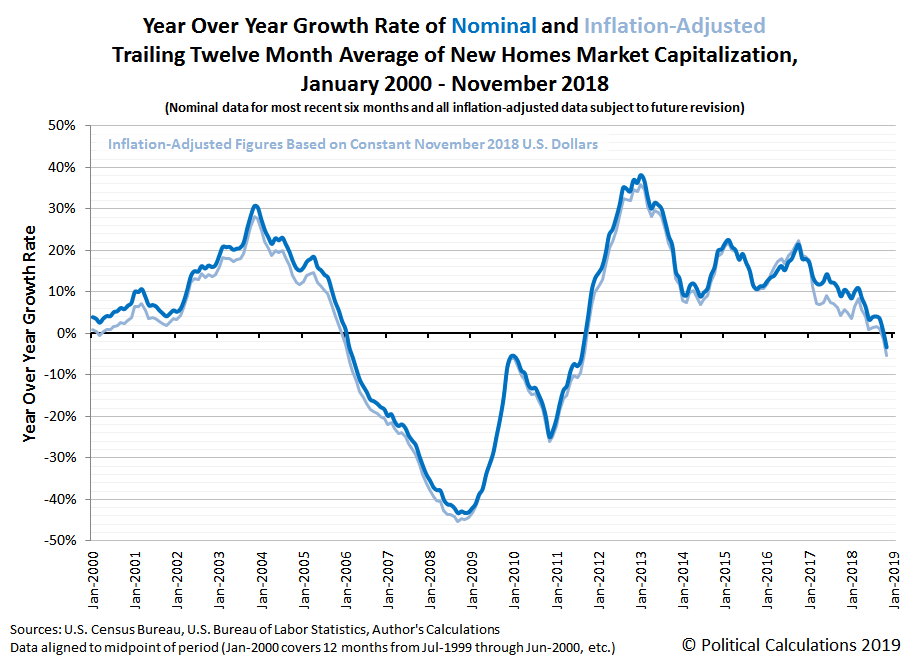
The initial year-over-year growth rate estimate for November 2018 is -3.3%, which if we re-do the growth rate math after adjusting all the market cap data for inflation to be in terms of constant November 2018 U.S. dollars, we find corresponds to an inflation-adjusted growth rate of -5.3%.
This deceleration parallels the trend we've seen in existing home sales since March 2018, but unlike that portion of the U.S. real estate market, the new homes market has greater economic impact, both for the businesses of U.S. homebuilders (Indices: ITB, PKB, XHB) and for the U.S. economy, where negative year-over-year growth rates indicate the industry has become an economic headwind.
On that count, Calculated Risk recently featured economist Tom Lawler's characterization of recent earnings calls for several firms in the industry, notably D.R. Horton (NYSE: DRH), the largest U.S. home builder, which has benefited in recent years by focusing on lower-priced, entry-level homes:
Here are a few observations based on press releases and conference calls (note that NVR provides no “color” in its press release and does not do an earnings conference.)
First (and trivially), D.R. Horton’s YOY increase in net orders was boosted slightly by acquisitions of a few smaller builders, and “pro forma” net orders would have been up by close to 2% YOY.
Second, all builders noted that they experienced slower demand last quarter, and most attributed the slowdown to “affordability” concerns, partly but not even mainly association with the increase in mortgage rates during the third and early fourth quarter, but also to the rapid price increases of the past few years in many markets. There appeared to be greater weakness at “higher” price points, and several markets where home prices had risen sharply over the past few years – especially much of California and Colorado – were “especially soft”.
Most builders were peppered with questions about sales incentives, and while those reporting incentives on closings said that there was just a “modest” increase from a year ago, many also implied that a further increase in sales incentives in the first part of this year was a distinct possibility. Most builders also seemed to feel that in aggregate home prices, after outpacing income growth for the last seven years, would likely grow by less than income growth in 2019. That is also the consensus among competent housing economists.
Aggregate home prices growing slower than income would continue the pattern we've observed for median new home sale prices and median household incomes since February 2018.
References
U.S. Census Bureau. Median and Average Sales Prices of New Homes Sold in the United States. [Excel Spreadsheet]. Accessed 31 January 2019.
U.S. Census Bureau. New Residential Sales Historical Data. Houses Sold. [Excel Spreadsheet]. Accessed 31 January 2019.
U.S. Department of Labor Bureau of Labor Statistics. Consumer Price Index, All Urban Consumers - (CPI-U), U.S. City Average, All Items, 1982-84=100. [Text Document]. Accessed 11 January 2019.
Disclaimer: Materials that are published by Political Calculations can provide visitors with free information and insights regarding the incentives created by the laws and policies described. ...
more

