
Gold: The Seasonal Lows Appear To Be In Place
Fundamentals
It has been difficult to trade the metals market over the past year. The fundamentals have been indicating that gold and silver should be shooting up, yet the markets have been going up and down a great deal. Emotions drive the markets to extremes, which we use AI to monitor and determine when the market hits those extremes and is most likely to revert back to the mean.

Image Source: Unsplash
We believe the debt ceiling will have to be increased or the world economy will be at risk of a potential collapse. They also cannot increase interest rates or defaults will ripple through the global economy like a tsunami. A rise in interest rates will also cause a massive correction in the equity markets, which the Fed is unlikely to risk occurring. The high debt levels and massive stimulus are destroying the value of the dollar, which should cause precious metals to soar, but they haven't yet. In the long run, we believe they will.
Myrmikan Research published a key report on gold on October 15, 2021. The report argued that the Fed's printing of money should have caused precious metals to rise in price. They have not, but that may be about to change. One key is the Fed does not really print money, they create bank reserves. Banks use the reserves to lend against assets, which then increase in value. Increasing the price of a financial asset while holding its cash flows constant means that discount rates fall.
If discount rates fall, then construction is favored, such as what happened in China and Manhattan. However, the building leads to overcapacity, which then reduces cash flows, lowering consumer prices and causing defaults for banks, unless central banks back them up by providing new reserves. Over time, if this cycle of bailouts continues, more and more of a society's capital gets invested in poor investments. They become like ancient Egypt's pyramids: a lot of economic activity, but with little result and nothing produced in the long term.
The COVID pandemic led the Fed and government to decide that no one should suffer too much from the pandemic economically. The Treasury paid those who could not work and helped businesses that were hit by the pandemic. Therefore, the Treasury directly contributed to consumer inflation. Since income and spending stayed the same in the face of falling supply due to the lockdown and supply chain issues, then prices had to rise.
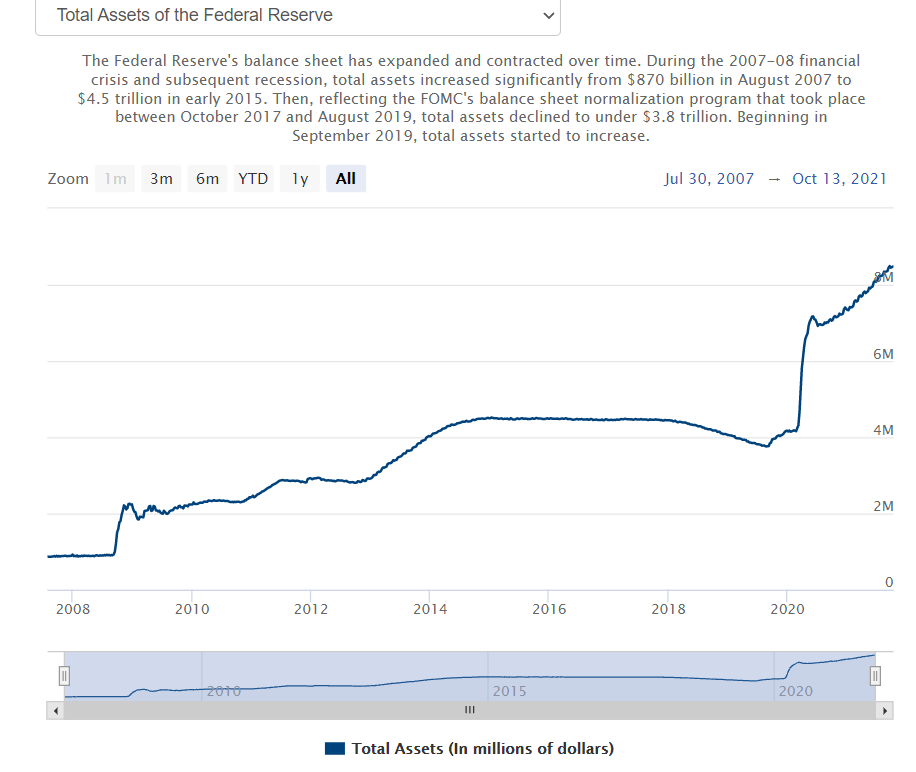
Source: Federal Reserve
Since the pandemic began, the Fed's balance sheet has more than doubled, triggering inflation. In the recent past technological innovations, China's growing workforce, underpriced investment capital, and the CPI being reconfigured to under-report inflation given decreases in quality all helped keep consumer inflation in check. Those four factors are no longer doing so. Technological innovations are now focused on entertainment, efficiency and financial speculation. China is facing a decrease in their number of workers due to the results of their one-child policy.
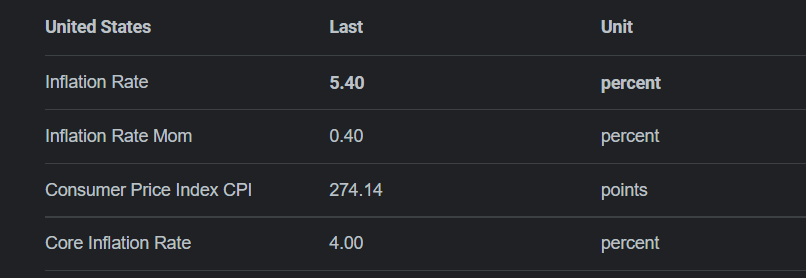
Source: tradingeconomics.com
Energy prices are surging, which suggests that inflation will not be temporary. There has been massive underinvestment in oil, natural gas, coal and nuclear, which are traditionally the most productive parts of the energy sector. Natural gas prices are rising, as are oil prices. In fact, inflation is hitting almost every commodity from copper to oats, cotton to soybeans. Everything is up double digit percentages--inflation.
When we have inflation, we also see high volatility, just as we are seeing today. The 1970s also saw major volatility in oil and other commodities.
With commodity prices and labor prices rising, consumer prices must follow. The CPI assumes that if filet mignon becomes too expensive they will shift to buying chuck steak. The price for "steak" remains the same, but the quality falls. That shift in buying to lower quality products hides inflation for a time, but if inflation hits double digits then that hiding becomes apparent to everyone.
If inflation hits double digits, the Fed may view it as a means of decreasing debt burdens. If inflation doubles the price of everything, then debt levels are halved, in a way. The problem is that inflation is not even, some sectors and goods will rise far higher than others. Inflation will also lead to more calls for government aid to certain groups. Such a situation would be great for gold miners, however. Commodity prices rise in terms of gold when credit increases, which suppresses gold mining margins; the reverse is also true. Therefore, gold mining is a bad business during periods of credit growth and a great business during credit crashes.
The Fed is unlikely to recognize this inflationary cycle, since the Fed appears to see the price increases as caused by supply chain issues--not other causes, such as the easy money policy of the government.
As the report concludes,
The surge of prices everywhere will either force yields higher or induce accelerating QE. The former would swiftly lead to a debt crisis and perhaps sovereign credit crisis. The latter destroys the currency. From 1971 to 1974 the gold price shot up five times. From 1978 to 1980 gold also rose five times. We are headed into similar times.
Buy gold.
Gold: Mean Reversion Trading
Source: ema2trade.com
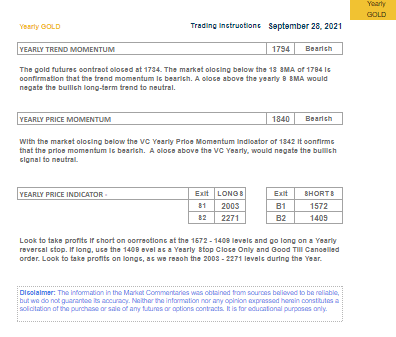
Our reports help you navigate the treacherous waters of the metals markets. Our annual gold report based on our Variable Changing Price Momentum Indicator (VC PMI), for example, published in September, argued that the annual trend momentum of $1794 was bearish. The price momentum for gold of $1840 was bearish. If short, on an annual basis, you should take profits at $1572 and $1409. If long, for the year from September to September, you should take profits at $2003 and $2271. The exit levels for the shorts are also excellent levels at which to enter the market and go long, while the levels to exit longs are great levels at which to enter the gold market and go short.
(Click on image to enlarge)

Source: TDAmeritrade
We have been trading gold above the monthly average price of $1772, which we did aggressively on October 13, then the price momentum turned bullish. Although we have some pullbacks on the short term, the bigger trend is bullish. We are seeing a lot of buyers come into the market. The monthly Sell 1 level is $1823, which is the monthly target. Right above it, is $1840, which is the 360-day moving average.
Even though the 360-day moving average is in a bearish momentum, we are beginning to see the momentum of the market based on the weekly and daily data give us an indication that the price momentum is turning bullish. A close above $1785 will negate the bearishness. The bottom in gold came in on the 29th. Since then, we have been moving up from $1721. The market is in a nice uptrend.
"This is the area where you want to accumulate," the Equity Management Academy CEO, Patrick MontesDeOca said.
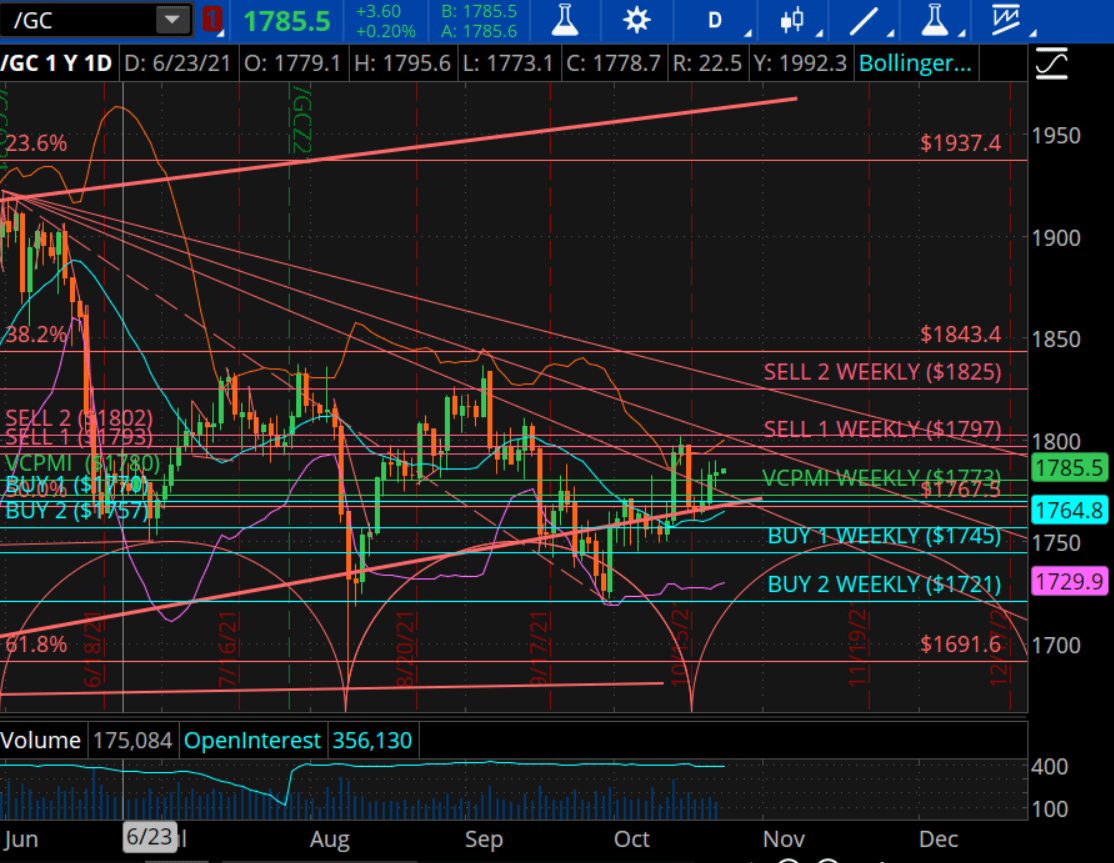
Source: TDAmeritrade
Gold traded above the daily level of support, at $1780. We are also above the weekly average price of $1783. Above that, the Sell 1 of $1793 and the daily at $1802. The market, by trading above the daily and weekly average, is in a bullish price momentum within the bigger annual bearish trend.
"The seasonal lows appear to be in place," MontesDeOca said. "We want to see the market test the levels of $1793, $1797 and $1802, all the way up to the weekly of $1825, which is the target for the rest of this week."
To learn more about how the VC PMI works and receive weekly reports on the E-mini, gold, and silver, check us out on Ticker ...
more

