
Gold, Silver And E-Mini 500 Correction Completed
Gold is trading last at $1574.60, up about 30 cents. The average price for the day is $1570. The Sell 1 level of the extreme above the mean is $1586 to the Sell 2 level of $1603. The Buy 1 level below the mean is $1561, the Buy 2 level is $1548.
(Click on image to enlarge)
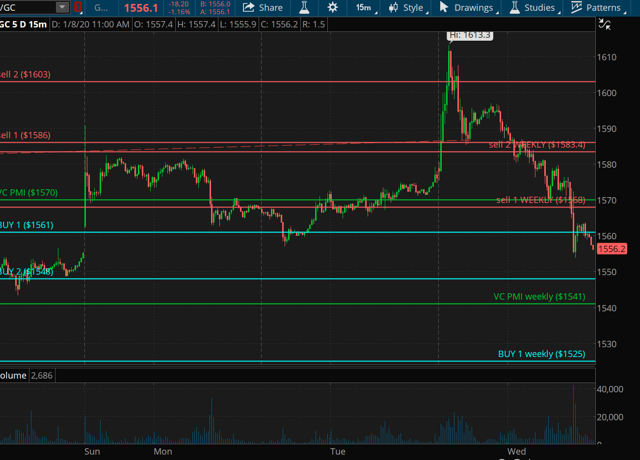
Overnight, on the news of the Iraq embassy bombing, the market rallied to make a high of $1613.30. This essentially went right into the target zones we were expecting of $1586-1603. The $1603 area on the daily signal indicates a very high-probability trade. The market closing below $1603 at 4:45 pm on the 7th activated a short trigger, which was on the news of the embassy bombing in Iraq. It then made a high of $1613.13 and reverted to activate a short signal from $1603, with the target below of $1586, which was the daily Buy 1 level. The weekly level of $1583 was also activated. By closing below $1583.40, it activated the target below of the daily mean of $1570 and the Sell 1 weekly level of $1568. A close below $1568 would activate the weekly mean of $1541 as a target. The daily targets below $1568 would be $1561-1548, if you are doing multiple positions.
Silver
(Click on image to enlarge)
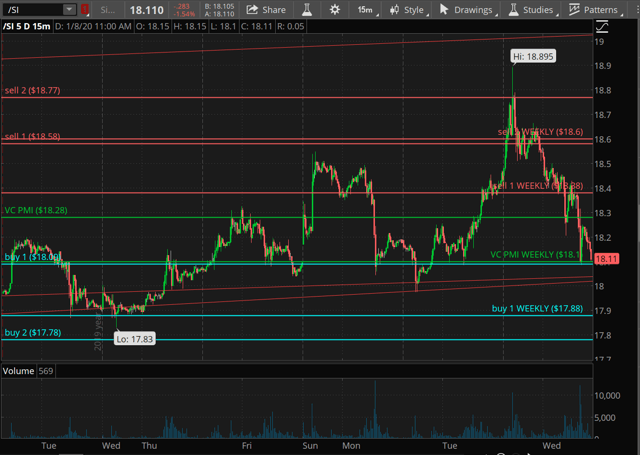
Silver is trading last at $18.3550, down 3.89 cents. The daily Sell 2 level is $18.77. The Sell 1 level is $$18.58. These are the levels above the mean for the day or average price, which is $18.28. The Buy 1 level is $18.09 and the Buy 2 level is $17.78.
The market overnight penetrated the Sell 1 level. On January 1, it activated a daily Buy signal, and you can see the energy of the market revert back up, reflecting the 90% probability of a reversion. Almost every time it came down to the Buy 1 level on the weekly signal, the market reverted. By the market making a high of $18.8950 today, it basically completed the target on the daily Sell 2 level of $18.77. After the completion of the target, the market closed at $18.77 and activated a short signal. The target was completed below of not only the daily target of $18.58, but also the weekly target of $18.60. The market traded around these levels, activating shorts, reverting back up again, and then finally at 11 pm on the 7th activated a short trigger - daily and weekly. Then the market ran down to our Sell 1 weekly target of $18.38 and came down to meet the target of the mean of $18.28. This is a perfect, classic, textbook example of reversion to the mean. If you are Sell 2, there is a 95% probability and from Sell 1 a 90% probability of a reversion to the mean, just as happened in this case.
The daily now is neutral. The weekly is on a short trigger on a close below $18.38. If you want to protect your position with a short at $18.38, you can use $18.38 as a stop on a closing basis. We do not recommend straight stops. If activated, the short trigger will activate the weekly mean level below, which is at $18.10. That is the target on this short trigger, which coincides with a Buy 1 trigger at $18.09. This is a harmonic alignment - when the daily price matches the weekly price almost exactly, that increases the probability for the market to revert, which it did. Silver reverted right into the new high of $18.99 and then reverted back down to $18.28, meeting our targets. That is about a 50-cent profit ($2,500 per futures contract), depending on your entry point and spillage.
E-mini S&P
(Click on image to enlarge)
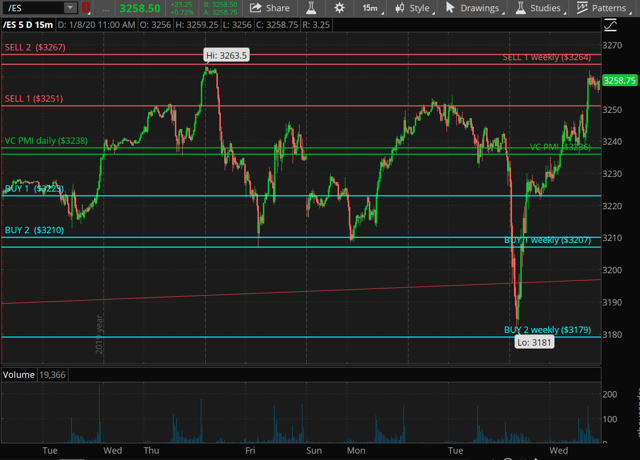
Last on the E-mini is 3246. It is up 11 points. The average price is 3238. The market is trading around the average price for the day and week, so it has activated a bullish trend momentum. It is not a signal, but a trend or price momentum. The average price represents the price momentum. The Variable Changing Price Momentum Indicator (VC PMI) acts as a GPS to guide you in your trading. As you can see, overnight the market fell from about 1 pm from 3238 and came down to meet almost the target of 3179. It met the Buy 1 target on the weekly and almost the Buy 2 target. When the market meets these levels, we suggest to our subscribers to take a profit and go neutral. Let the market confirm the next move and determine the energy of the market. We do not recommend going short if the signal is activated between the Buy 1 or Buy 2 levels. It is a low-probability trade. The area represents a high level of demand; expect demand to show up at these levels.
The first time the market touches a level, it's a setup. The second time, it's a trigger. In this case, you would go long from 3216. It is a bit far away from the 3210, the Buy 2 daily or the Buy 1 weekly. Your stop is the level below. If you're trading the daily signal, put your stop on the daily level below. If you're trading the weekly signal, use the weekly stop: 3210 or 3207. The market ran up above the Buy 1 level, activated another buy signal from 3223 and it never got stopped out. It took off to meet the daily and weekly targets. Now, we are in a neutral position. We took a profit overnight. Now let the market once again activate the levels of demand. If it goes up to the 3251 level, then the algorithm identifies a 90% probability if the signal is activated of the market reverting back to the mean. The targets activated below are of 3258-3237.
Disclosure: I am/we are long NUGT. I wrote this article myself, and it expresses my own opinions.
To learn more about how the VC PMI works and receive weekly reports on the E-mini, gold and ...
more

