
Gold Prices Vulnerable Ahead Of FOMC As Bullish Momentum Abates
The near-term outlook for gold has become uneventful as the price for bullion consolidates within the monthly range, and the precious metal now stands at risk for a larger pullback as the bullish momentum appears to be abating.
GOLD PRICES VULNERABLE AHEAD OF FOMC AS BULLISH MOMENTUM ABATES

Gold trades within a narrowing range following the failed run at the June-high ($1309), and the precious metal may continue to chop around ahead of the Federal Reserve interest rate decision on January 30 as a growing number of Fed officials tame bets for an imminent rate hike.
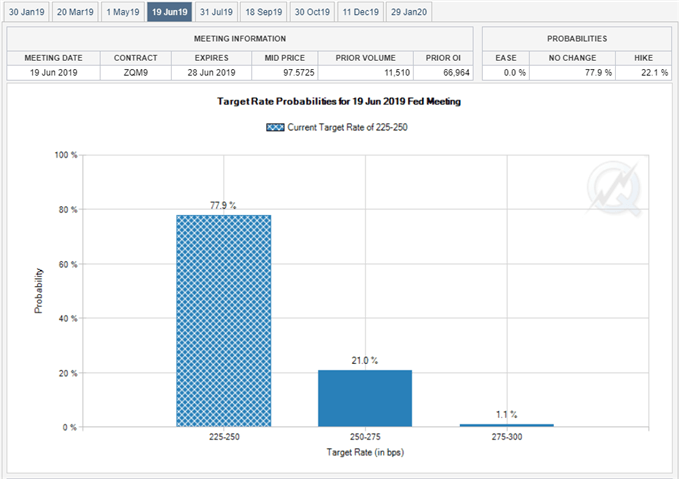
It seems as though the Federal Open Market Committee (FOMC) will alter the forward-guidance for monetary policy as the longest U.S. government shutdown in history clouds the economic outlook, and Fed Fund Futures may continue to show the central bank on hold throughout the first-half of 2019 as the uncertainty surrounding fiscal policy puts pressure on the Fed to conclude its hiking-cycle ahead of schedule.
Waning bets for higher U.S. interest rates instills a constructive outlook for gold especially as the slowdown in global growth drags on risk-taking behavior, but it remains to be seen if the FOMC will scale back the $50B/month in quantitative tightening (QT) as Chairman Jerome Powell sees the balance sheet to return to a ‘more normal level’.
With that said, gold prices may continue to benefit from the current environment as Fed officials drop the hawkish outlook for monetary policy, but there appears to be further shifting in retail sentiment as traders fade the stickiness in gold prices.
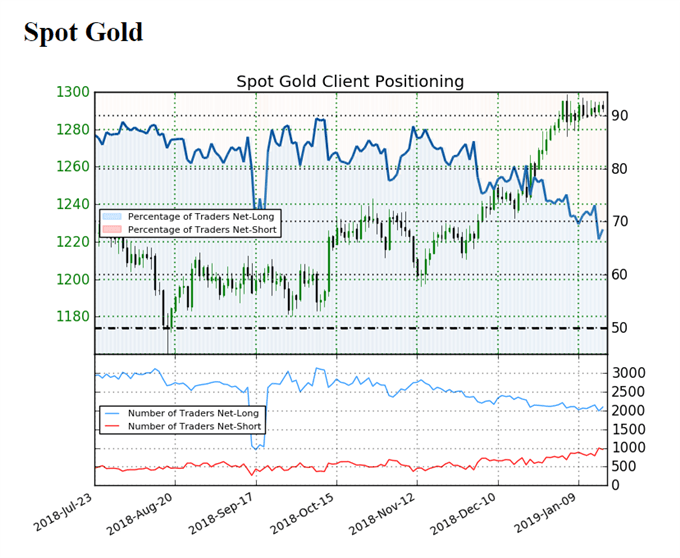
The IG Client Sentiment Report shows 68.5% of traders are now net-long gold compared 69.5% last week, with the ratio of traders long to short at 2.18 to 1. Keep in mind, the percentage of traders net-long is now its lowest since September 03 when gold traded near $1200.The number of traders net-long is 4.9% lower than yesterday and 3.4% higher from last week, while the number of traders net-short is 15.4% higher than yesterday and 1.4% higher from last week.
There appears to be a small pickup in market participation despite the range-bound price action, and the ongoing expansion in net-short exposure may foreshadow a more dynamic shift in market sentiment as traders appear to be betting on lower gold prices.
Nevertheless, the broader outlook for gold remains constructive as it continues to track the upward trend from the previous year, but recent developments in the Relative Strength Index (RSI) warn of a larger pullback as the oscillator deviates with price and snaps trendline support.
GOLD DAILY CHART
(Click on image to enlarge)
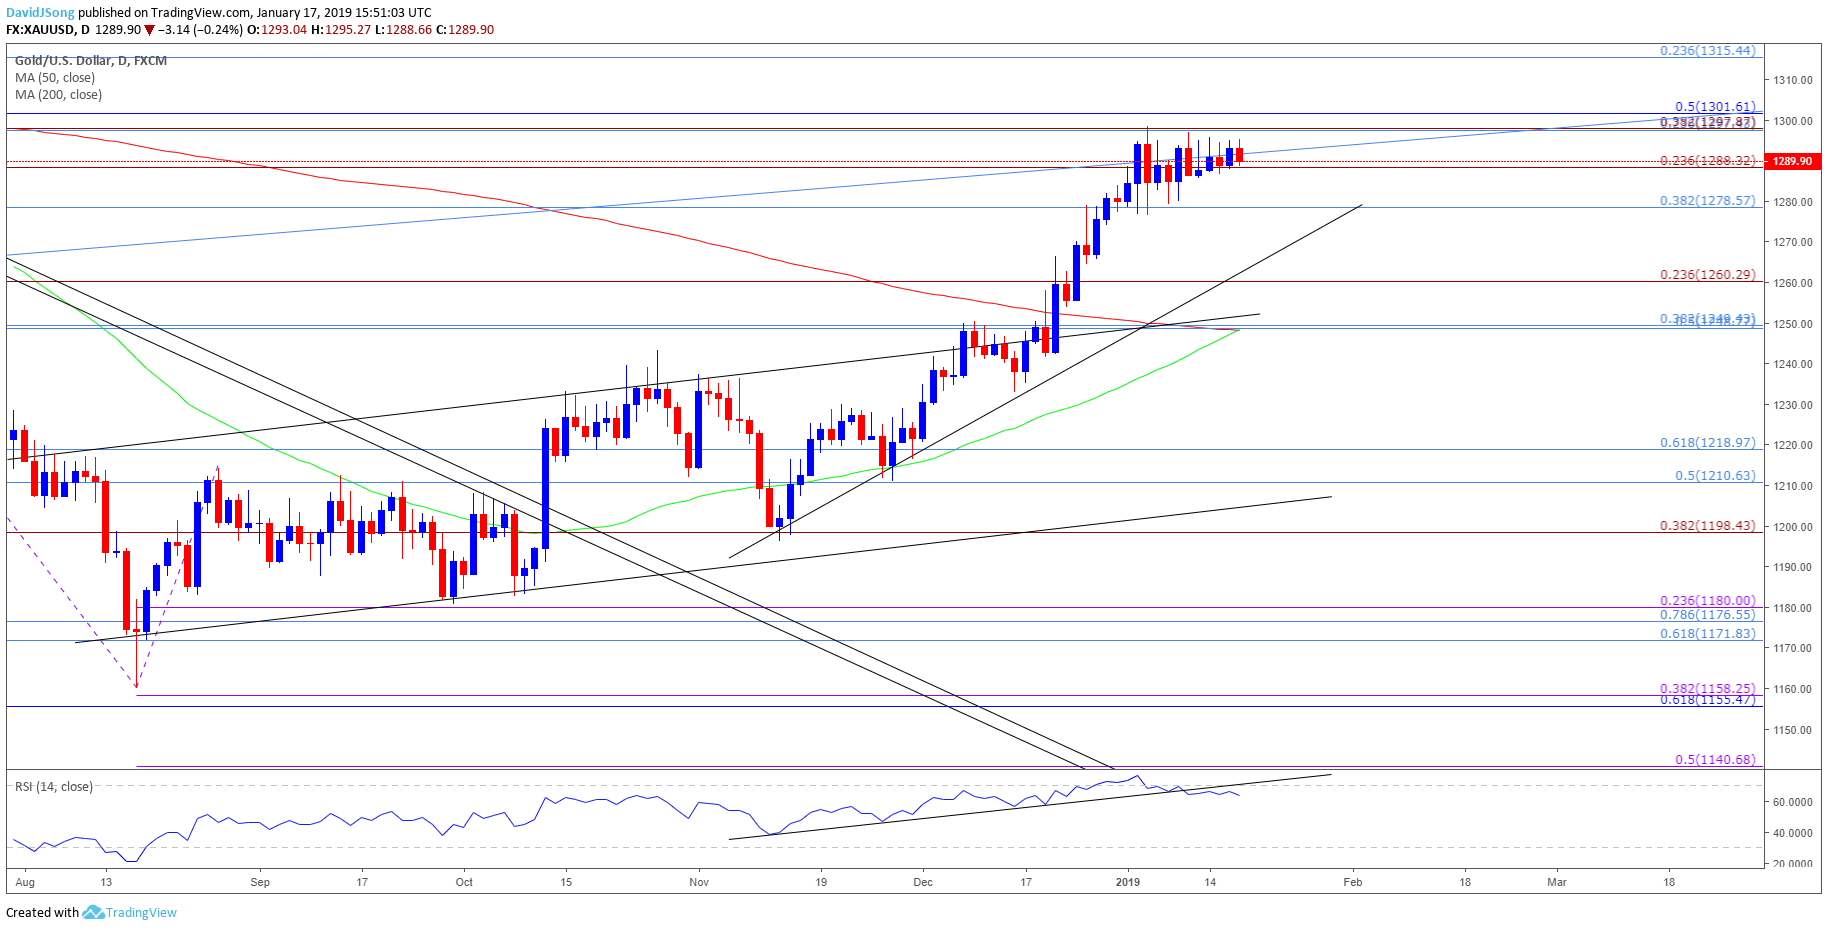
- The advance from the November-low ($1196) appears to have stalled ahead of the June-high ($1309), with the lack of momentum to break/close above the $1298 (23.6% retracement) to $1302 (50% retracement) region raising the risk for a larger pullback as the RSI flashes a bearish signal.
- In turn, a move below $1288 (23.6% expansion) brings the $1279 (38.2% retracement) region on the radar, with the next area of interest coming in around $1260 (23.6% expansion).


