Gold Prices Remain Bid Amid Partial U.S. Government Shutdown
GOLD TALKING POINTS
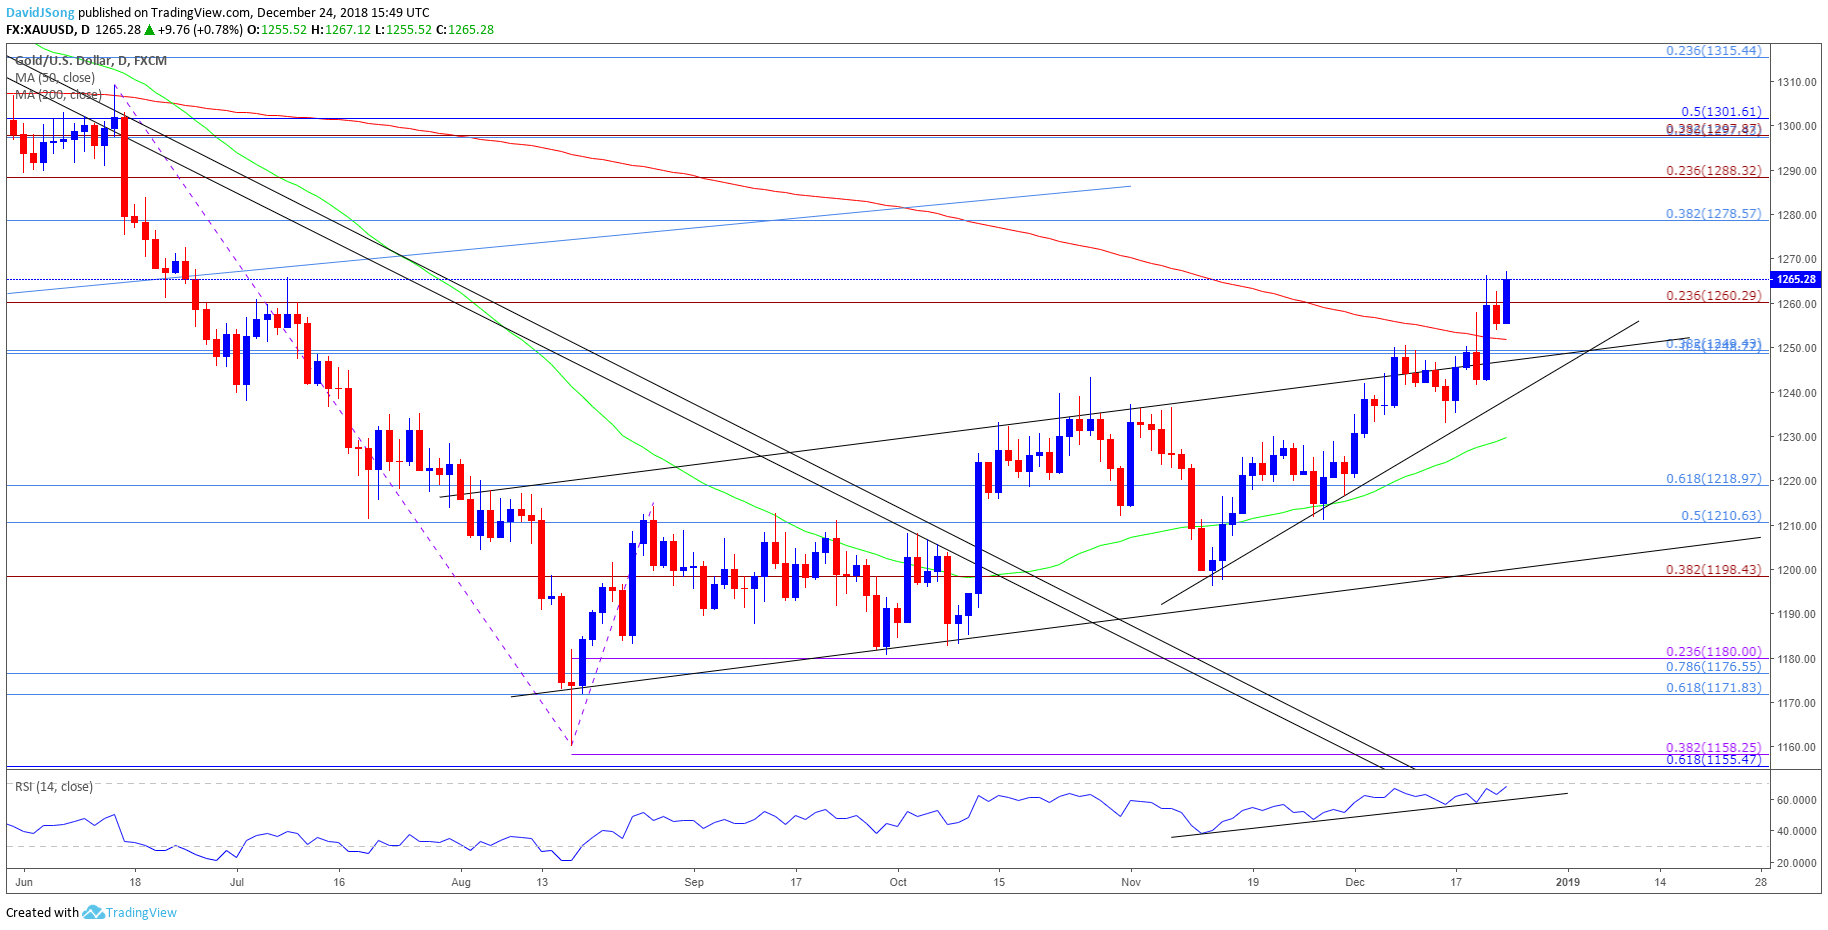
Gold trades to a fresh monthly-high ($1267) amid the partial U.S. government shutdown, and the precious metal may continue to gain ground over the remainder of the year as the price for bullion closes above the 200-Day Simple Moving Average (SMA) for the first time since May.
GOLD PRICES REMAIN BID AMID PARTIAL U.S. GOVERNMENT SHUTDOWN
The bearish reaction to the Federal Reserve rate-hike was short-lived as the gridlock in Congress boosts the appeal of bullion ahead of the Christmas holiday, and gold prices may continue to track higher over the coming days as both price and the Relative Strength Index (RSI) preserve the bullish formations carried over from the previous month.

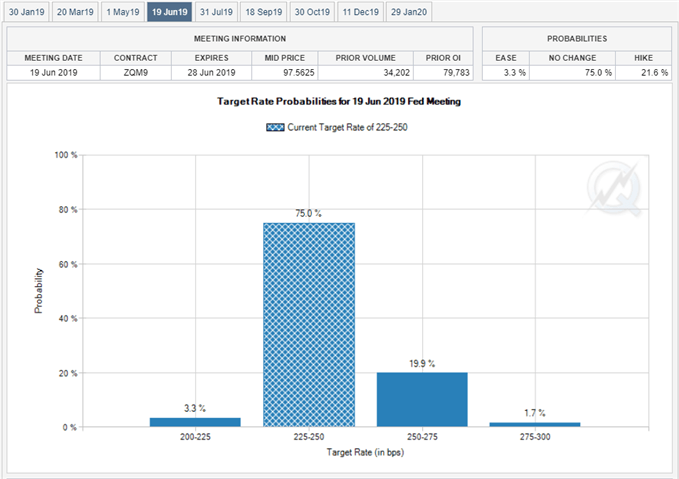
With the deadlock set to last at least until Thursday, the uncertainty surrounding fiscal policy may ultimately disrupt economic activity and drag on the growth outlook especially as President Donald Trump tweets that ‘if the Dems vote no, there will be a shutdown that will last for a very long time.’ In response, the Federal Reserve may continue to soften its hawkish tone in 2019 as Fed Fund Futures highlight limited expectations for an imminent rate-hike, and the central bank may stay on hold throughout the first-half of the year as officials ‘see growth moderating ahead.’
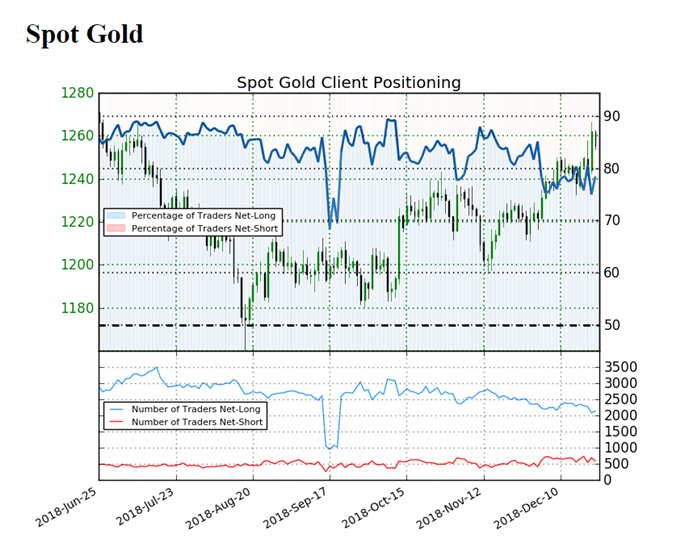
Even though the Federal Open Market Committee (FOMC) continues to project a longer-run interest rate of 2.75% to 3.00%, Chairman Jerome Powell & Co. may ultimately conclude the hiking-cycle in 2019 as U.S. households face subdued wage growth paired with cost-push inflation emerging from the shift in the U.S. trade policy. In turn, diminishing bets for an higher U.S. interest rates may keep gold prices afloat, but sentiment surrounding bullion remains skewed as the retail crowd continues to bet on a larger correction.

The IG Client Sentiment Report shows 78.5% of traders are still net-long gold compared 78.3% last week, with the ratio of traders long to short at 3.64 to 1. The number of traders net-long is 2.7% higher than yesterday and 7.0% lower from last week, while the number of traders net-short is 16.7% lower than yesterday and 8.7% higher from last week.
The persistent tilt in retail interest undermines the recent advance in bullion as it offers a contrarian view to crowd sentiment, but the near-term outlook for gold remains supportive as the precious metal continues to track the upward trending channel from August. Moreover, gold prices have closed above the 200-Day Simple Moving Average (SMA) for the first time since May, with the development highlighting a near-term shift in market behavior, and the Relative Strength Index (RSI) highlights a similar dynamic as it extends the bullish formation carried over from the previous month and flirts with overbought territory.
GOLD DAILY CHART
(Click on image to enlarge)

- The break above the October-high ($1243) keeps the topside targets on the radar for gold, but now need a close above $1260 (23.6% expansion) to open up the Fibonacci overlap around $1279 (38.2% retracement) to $1288 (23.6% expansion).
- Keeping a close eye on the RSI as it approaches overbought territory, with a break above 70 raising the risk for a larger advance in gold prices.
- Next area of interest comes in around $1298 (23.6% retracement) to $1302 (50% retracement) followed by the $1315 (23.6% retracement) area.
Disclosure: Do you want to see how retail traders are currently trading the US Dollar? Check out our IG Client Sentiment ...
more


