
Gold Prices Hold Tight Range Ahead Of FOMC, North Korean Summit
Gold prices inched higher this week with the precious metal up nearly 0.30% ahead of the New York close on Friday. The gains come amid continued strength in U.S. equity markets with the S&P 500 pressing higher for a third consecutive week. A newfound weakness in the US Dollar has continued to put a floor under gold prices with the DXY down nearly 0.7% this week.
FOMC RATE DECISION TAKES CENTER STAGE
It was a quiet week for economic data but things pick up next week with central bank rate decisions from the FOMC, the ECB (European Central Bank) and BoJ (Bank of Japan) on tap. The Federal Reserve is widely expected to hike the benchmark interest rate by 25 basis points and the focus will be on the updated economic projections as they pertain to growth, employment and inflation. For gold, a hawkish tone from the central bank could weigh on demand for non-yielding assets like gold. However, with growing concerns regarding a mounting global trade war, Fed Chair Jerome Powell & Co may leave the door open for a more gradual normalization process if the dot plot reaffirms expectations for just one more hike this year- such a scenario would likely be bullish for gold,
NORTH KOREAN SUMMIT – THE "X" FACTOR
Further highlighting event risk next week will be the highly anticipated meeting between President Trump and North Korean Leader Kim Jong Un for the Nuclear Summit- an X factor for traders that could be a big driver of near-term risk sentiment (depending on how things go). For gold, these events have the potential to fuel a break of a multi-week range in price. Keep in mind that despite all the volatility seen in prices in 2018, bullion is down just 0.5% year-to-date and from technical standpoint, we’re looking for a breakout a near-term consolidation range to offer guidance.
SPOT GOLD IG CLIENT POSITIONING
(Click on image to enlarge)
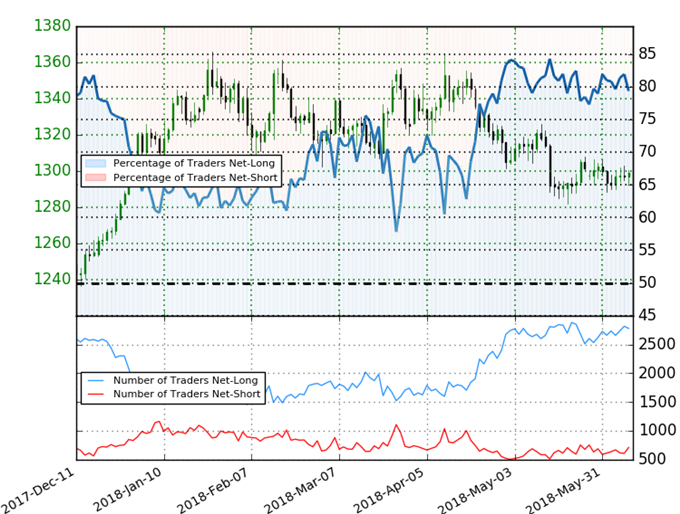
- A summary of IG Client Sentiment shows traders are net-long Gold- the ratio stands at +3.93 (79.7% of traders are long) –bearishreading
- Long positions are 2.3% lower than yesterday but1.2% higher from last week
- Short positions are 5.9% higher than yesterday and 5.7% higher from last week
- We typically take a contrarian view to crowd sentiment, and the fact traders are net-long suggests Spot Gold prices may continue to fall. Yet traders are less net-long than yesterday and compared with last week and the recent changes in sentiment warn that the current Spot Gold price trend may soon reverse higher despite the fact traders remain net-long.
GOLD WEEKLY PRICE CHART
(Click on image to enlarge)
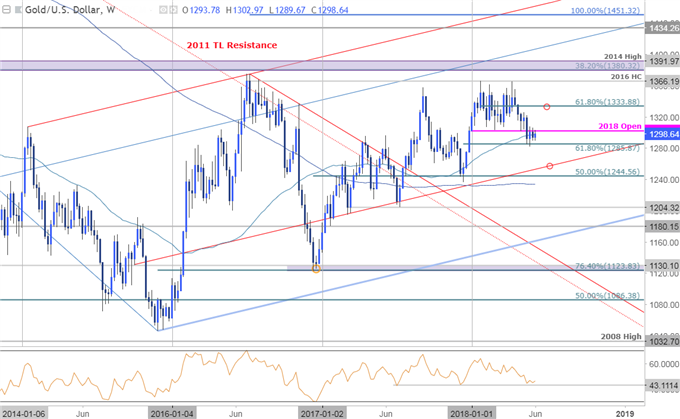
Gold prices have continued to trade in a contractionary range just below yearly open resistance at 1302 with support eyed at the 61.8% retracement of the December advance at 1285. A weekly close below this level targets longer-term upslope support around ~1255 backed closely by the 50% retracement of the late 2016 advance at 1245.
Bottom line: It’s make-or-break at these levels and we’re looking for a breakout of this range heading into next week. Note that the last few times that weekly RSI has fallen to these levels, price has recovered and adds further significance to the current momentum profile. For a complete technical breakdown of the near-term Gold price levels (daily & intraday), review this week’s XAU/USD Technical Outlook.
Disclosure: Do you want to see how retail traders are currently trading the US Dollar? Check out our IG Client Sentiment ...
more

