
Gold Prices Fall On US-China Trade Hopes, US Retail Sales Loom
Gold prices fell on Friday with risk appetite stoked by hopes that US-China trade talks can make progress.
There seemed to be snags earlier this week with the US seeming to walk away from the idea that any rollback of tariffs was imminent, while China for its part was reportedly opposed to guaranteeing more US agricultural product purchases. However, White House economic adviser Larry Kudlow said on Thursday that an interim agreement between the two economic titans could come soon, and that seems to have cheered Asian stock markets as the week bows out at the expense of haven assets like gold.
It is highly possible that ongoing political unrest in Hong Kong is maintaining gold’s haven bid even as the market’s main focus is ostensibly elsewhere.
The next major risk event for all markets will come soon enough, however, with preliminary official US retail sales numbers for October due later on Friday. Sales are expected to have bounced back modestly from September’s 0.3% on-month fall but aren’t expected to have risen enough to do anything to interest rate expectations.
Crude oil prices also saw gains based on this renewed trade optimism, but that wasn’t all that supported the market. The next major meeting of the Organisation of Petroleum Exporting Countries is coming up next month at its headquarters in Vienna. Forecasters and analysts suspect that a lid will be kept on production with the cartel forecasting that next year’s aggregate demand will be about a million barrels per day less than in 2019.
GOLD TECHNICAL ANALYSIS
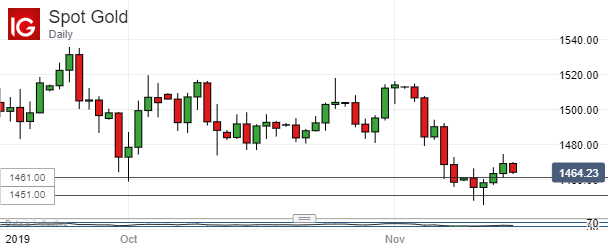
Gold prices had risen quite sharply this year, largely in response to trade-related worries. However they have backed down again since September with the daily chart showing a bounce this week at an important band of near-term support between $1451 and $1461.
The metal’s immediate fate may rest on the bulls ability to consolidate matters above this area, but it’s far from certain that they will make huge progress back towards September’s highs even if they can. In the probably more likely event that support gives way, focus will quickly turn to the area around $1435 where the market was last found back in July.
CRUDE OIL TECHNICAL ANALYSIS
Prices remain within their dominant, gradual daily-chart uptrend and, with little sign of overbuying in the momentum indicators, may retain their upward bias.
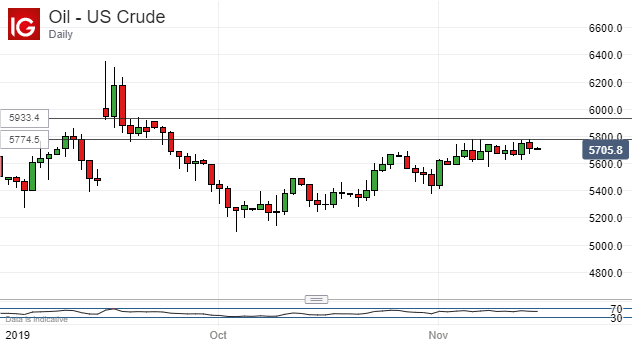
However, bulls have yet to crack a zone of resistance which guards the way back to September’s highs. They will need to take the market back above $57.74 to break back into that zone and keep the market there. Attempts to break into this area have been foiled on an intraday basis for nearly two weeks so it clearly bears watching.


