Saturday, August 1, 2020 12:20 PM EDT
Source: IG Charts
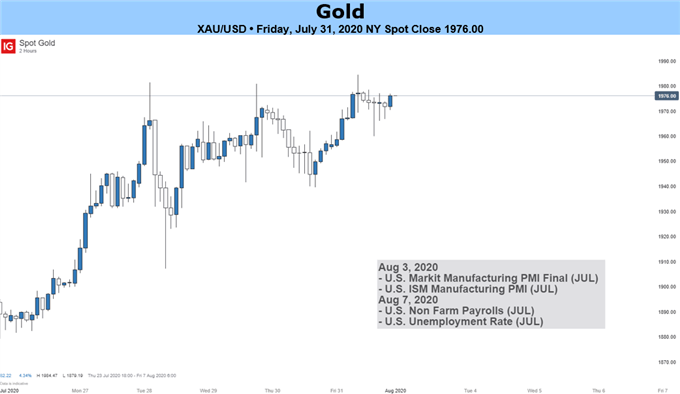
GOLD PRICE (XAU/USD) ANALYSIS, PRICE AND CHART
- Gold consolidates just below this week’s record high.
- 10-year US real yields near -1.00%.
Gold printed a fresh new all-time high earlier this week before backing off a fraction, as US real yields fell further into negative territory. The latest 10-year data shows US real yields are nearly -1.0%, down from +0.6% in mid-March as the Fed continues to pump US dollars into the system. Gold and US real yields have a strong negative correlation and this continues to hold.
Political uncertainty also remains a key driver of gold’s multi-month rally and this is likely to remain the case all the way up to the US Presidential Elections in November, unless President Trump delays them as he suggested in a tweet on Thursday. While this is exceedingly unlikely, it adds another layer of uncertainty to what is already expected to be a very volatile US election period.
In addition, and of more immediate concern, the US-China relationship continues to breakdown further and this, along with fears of a full-blown bubble developing in the US stock markets, will underpin any sell-off in gold.
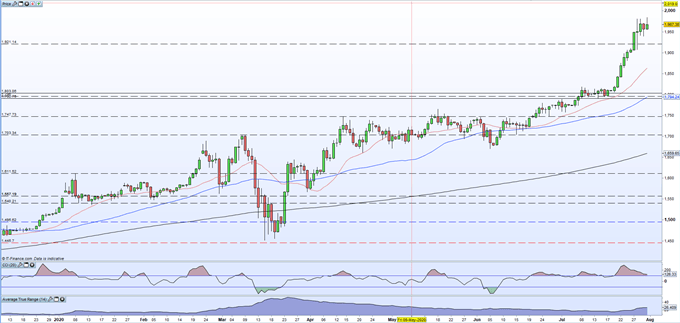
The daily chart shows the gold market became extremely stretched at the end of last week, with the CCI indicator showing the market in extreme overbought territory. This set-up is now beginning to ease, and while gold remains above $1,906/oz. – last Friday’s high and Monday and Tuesday’s low prints – the outlook remains positive.
GOLD DAILY PRICE CHART (DECEMBER 2019 – JULY 31, 2020)
DailyFX Economic Calendar
Disclaimer: DailyFX, the free news and research website from IG, is one of the world's leading sources for news and analysis on the currency, commodity and index trading community. With nine internationally-based analysts publishing over 30 articles and producing 5 video news updates daily, DailyFX offers in-depth coverage of price action, predictions of likely market moves, and exhaustive interpretations of salient economic and political developments. DailyFX is also home to one of the most powerful economic calendars available on the web, complete with advanced sorting capabilities, detailed descriptions of upcoming events on the economic docket, and projections of how economic report data will impact the markets. Combined with the free charts and live rate updates featured on DailyFX, the DailyFX economic calendar is an invaluable resource for traders who heavily rely on the news for their trading strategies. Additionally, DailyFX serves as a portal to one of the most vibrant online discussion forums in the forex trading community. Avoiding market noise and the irrelevant personal commentary that plague many forex blogs and forums, the DailyFX Forum has established a reputation as being a place where real traders go to talk about serious trading.
Any opinions, news, research, analyses, prices, or other information contained on dailyfx.com are provided as general market commentary and does not constitute investment advice. Dailyfx will not accept liability for any loss or damage, including without limitation to, any loss of profit, which may arise directly or indirectly from use of or reliance on such information.
less
How did you like this article? Let us know so we can better customize your reading experience.


