
Gold Price Reversal From July High Unfolds During Fed Blackout Period
Gold Price Talking Points
The price of gold tumbles to a fresh monthly low ($1755) following the better-than-expected US Retail Sales report, and bullion may face a further decline ahead of the Federal Reserve interest rate decision on September 22 amid broad based weakness across precious metals.

Image Source: Pixabay
Gold Price Reversal From July High Unfolds During Fed Blackout Period
The price of gold appears to have reversed course following the failed attempt to July high ($1834), and the precious metal may continue to weaken during the Federal Reserve’s blackout period as the central bank appears to be on track to normalize monetary policy.

The update to the US Retail Sales report may encourage the Federal Open Market Committee (FOMC) to taper the quantitative easing (QE) program sooner rather than later as household consumption expectedly expands 0.7% in August, and speculation for an imminent shift in Fed policy may continue to drag on the price of gold as Chairman Jerome Powell acknowledges that the central bank could shift gears later this year “if the economy evolved broadly as anticipated.”
As a result, the FOMC may layout a tentative exit strategy as Fed officials forecast two rate hikes for 2023, and it remains to be seen if Chairman Powell and Co. will implement material changes to the Summary of Economic Projections (SEP) as the update to the US Consumer Price Index (CPI) reinforces the central bank’s expectations for a transitory rise in inflation.
Until then, the price of gold may continue to trade to fresh monthly lows as fresh data prints coming out of the US instill an improved outlook for growth, and the precious metal may continue to give back the rebound from the August low ($1682) following the failed attempt to the failed attempt to clear the July high ($1834).
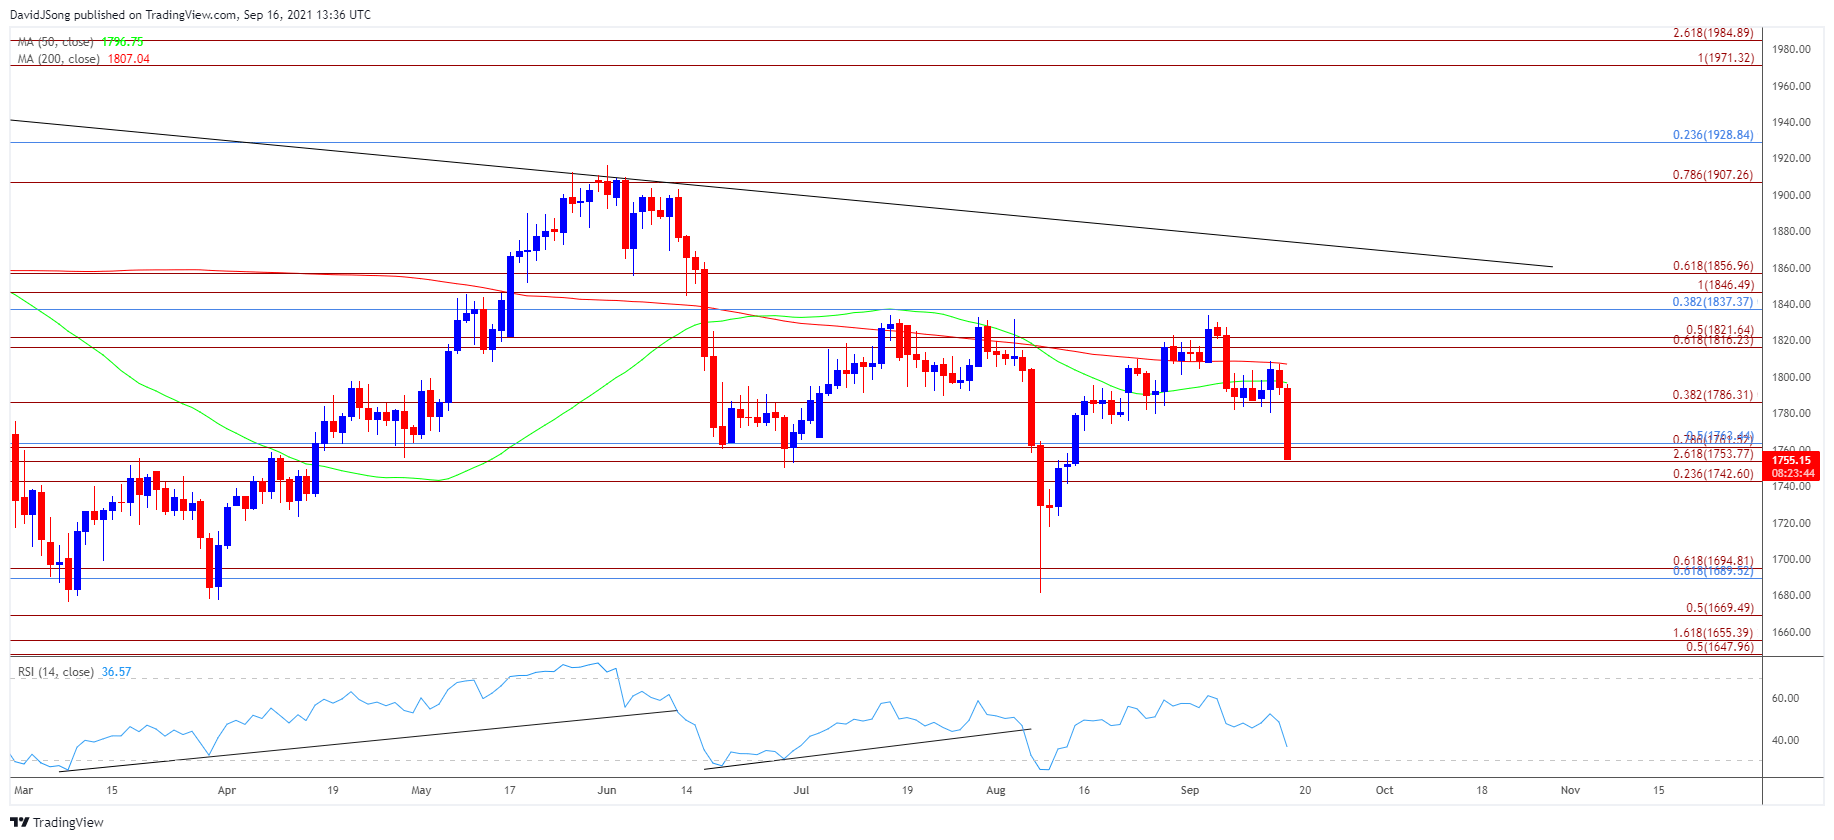
With that said, the price of gold may continue to track the downward trend carried over from the previous year as the 200-Day SMA ($1807) still reflects a negative slope, and looming developments in the Relative Strength Index (RSI) may show the bearish momentum gathering pace if the oscillator pushes into oversold territory.
Gold Price Daily Chart
(Click on image to enlarge)
Source: Trading View
- Keep in mind, the negative slope in the 200-Day SMA ($1807) indicates that the broader trend for bullion remains tilted to the downside, with a ‘death cross’ formation taking shape in August as the Relative Strength Index (RSI) pushed into oversold territory.
- Nevertheless, lack of momentum to test the March low ($1677) generated a textbook buy signal in the RSI as the oscillator climbed back above 30, but the price of gold appears to tracking the downward trend carried over from the previous year as it reverses following the failed attempt to July high ($1834).
- In turn, the rebound from the August low ($1682) may turn out to be a correction in the broader trend as the price of gold trades back below the 200-Day SMA ($1807), but need a break/close below the Fibonacci overlap around $1743 (23.6% expansion) to $1763 (50% retracement) to bring the $1690 (61.8% retracement) to $1695 (61.8% expansion) region on the radar.
- A break of the August low ($1682) opens up the March low ($1677), with the next area of interest coming in around $1670 (50% expansion).
Disclosure: See the full disclosure for DailyFX here.


