
Gold Price Outlook: XAU Pull Back To Fibonacci Support
GOLD PRICES PULL BACK TO SUPPORT
Gold prices are currently testing a level of support at 1509 after setting another fresh six-year-high earlier this week. As discussed in yesterday’s webinar, the longer-term resistance zone that runs from 1509-1527 has helped Gold’s short-term price action build into a range; and a support inflection off of the 1509 level kept the door open for aggressive bullish trend strategies.
GOLD PRICE TWO HOUR CHART
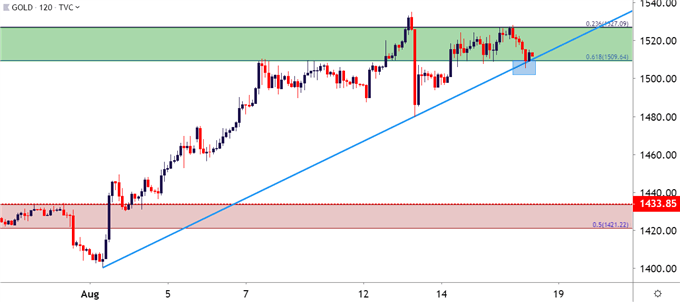
Chart prepared by James Stanley; Gold on Tradingview
THE BIGGER PICTURE BACKDROP FOR GOLD PRICES
Fear continues to populate the backdrop and for Gold prices, that’s generally a ‘good’ thing despite the related ramifications. As a number of risks remain in the headlines and at this point, the Fed has been noticeably silent on the matter; markets have been left to their own projections and prognostications and Gold prices have put in some serious incline already in 2019, continuing to push up to fresh six-year-highs despite remaining overbought. That’s what has quickly brought this zone back into play.
GOLD PRICE WEEKLY CHART
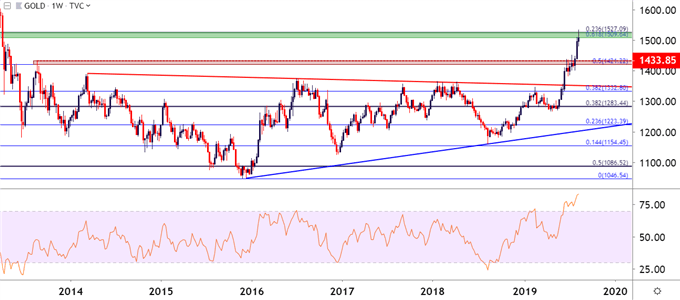
Chart prepared by James Stanley; Gold on Tradingview
The current zone of resistance comes from two different Fibonacci levels at 1509 and 1527, with the former of those prices as the 61.8% retracement of the 2012-2015 major move and the latter serving as the 23.6% marker of the longer-term bullish run from 1999 into the 2011 highs. I had started looking at this zone for topside target potential about a month ago and when price action had stalled in the 1421-1433 zone. But as risk aversion caught a bid around the FOMC rate cut and the tariff announcement that followed, bulls pressed the bid again to set even higher-highs.
GOLD PRICE FOUR-HOUR CHART
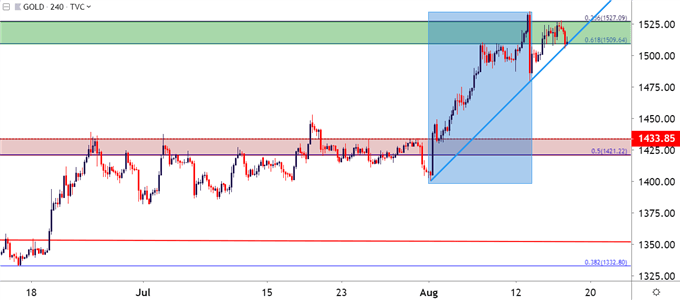
Chart prepared by James Stanley; Gold on Tradingview
GOLD PRICE STRATEGY
As noted earlier, for aggressive strategies, the current area of support could remain usable, with initial targets set at short-term range resistance of 1527, which could be coupled with a break-even stop move so that the remainder of the position could be held for breakout scenarios.
A bit more conservatively, traders could look for a deeper pullback, plotting around the 1480 swing low from this week combined with the prior swing-high around 1475. If that doesn’t hold, a larger retracement might be afoot at which point bulls would likely want to exercise some patience. These deep overbought/oversold conditions could spell for two-way volatility if, in fact, semblance is restored and fear recedes. We may even see that prior zone of resistance that runs from 1421-1433 come back into play for a support test, and that’s like a drawdown that buyers would not want to hold long through. So, keeping risk limited remains the upmost of importance.
GOLD PRICE FOUR-HOUR CHART
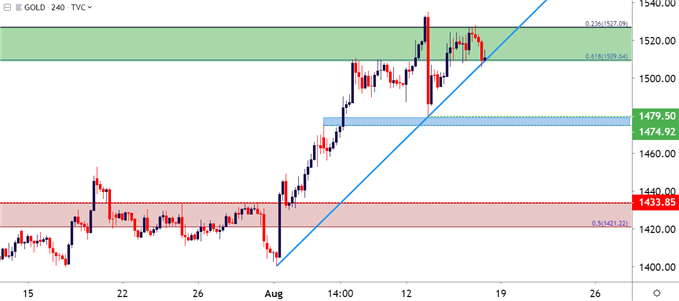
Chart prepared by James Stanley; Gold on Tradingview


