
Gold Price Outlook: Rising Yields Threaten Bull Flag Breakdown
Precious metals continue to lose their luster as gold and silver prices extend their selloff. Gold price action just dropped another -1.2% during Monday trade to print a fresh nine-month low and leaves it the most oversold since August 2018. The price of gold now hovers on the brink of bear market territory near $1,680/oz. This latest stretch lower could see gold selling pressure accelerate due to the latest breakdown of technical support around $1,690/oz.
GOLD PRICE CHART WITH US DOLLAR INDEX OVERLAID: WEEKLY TIME FRAME (DEC 2019 TO MAR 2021)
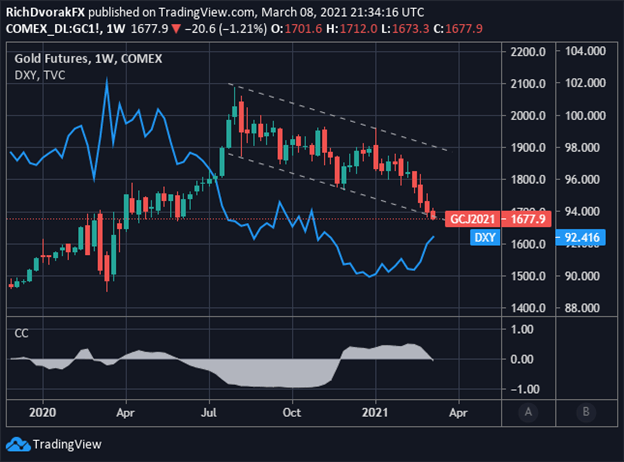
Chart by @RichDvorakFX created using TradingView
One primary driver of gold price weakness has been surging real yields. More recently, the rise in real yields has also corresponded with a stronger US Dollar. This poses a major headwind for gold bulls considering the precious metal typically maintains an inverse relationship with the US Dollar.
Gold price action appears to be at a critical juncture with its broader bull flag chart pattern now in jeopardy following the latest stretch lower. Failure to catch a bid off this key technical barrier might open the door to a deeper pullback toward long-term trendline support extended through the April 2019 and March 2020 swing lows. If a rebound attempt comes into play, however, gold bears might look to fade the 20-day simple moving average.
Disclosure: See the full disclosure for DailyFX here.


