
Gold Price Forecast: XAU/USD Needs To Crack $1812 To Unleash Further Upside – Confluence Detector
Gold price is consolidating at higher levels on Monday, kicking off a big week on the right footing. Gold bulls are back in the game after having found solid support around the $1798 region. The downbeat market mood remains the key underlying theme so far, boosted the haven flows into the US Treasuries and gold while weighing on the yields. The benchmark 10-year US Treasury yields are down nearly 5% on the day. Escalating covid concerns and a tense start to the US-Sino trade talks dampen the investors’ sentiment. Additionally, worse than expected German IFO Survey for July intensified economic growth concerns, underpinning gold price.
Image Source: Unsplash
However, it remains to be seen if gold price can sustain the upside, as markets bet on a hawkish hint from the FOMC meeting this week. The Fed is widely anticipated to signal at a likely taper starting off from the quarter of this year.
Gold Price: Key levels to watch
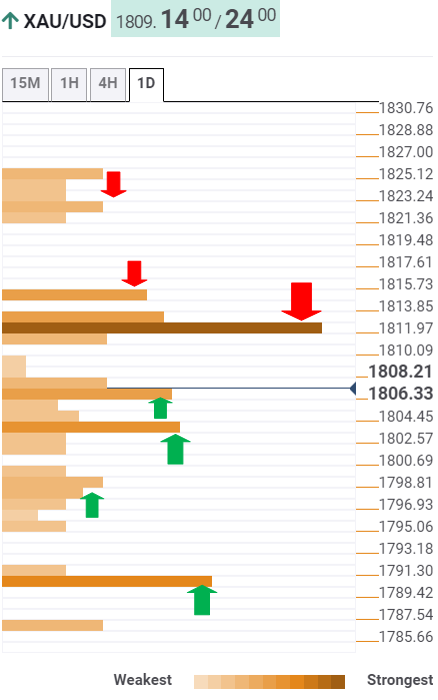
The Technical Confluences Detector shows that gold has stalled its recent advance just below the powerful resistance at $1812, which is the convergence of the Fibonacci 61.8% one-week, SMA10 one-day and pivot point one-day R1.
A firm break above that level will challenge the immediate upside barrier at $1814, the Fibonacci 38.2% one-month.
Further up, a dense cluster of healthy resistance levels is seen around $1823, where the SMA200 one-day, the previous week’s high and Fibonacci 161.8% one-day coincide.
On the flip side, gold price will test the $1806 support area, the intersection of the SMA200 four-hour and SMA100 one-hour.
Sellers will then target the confluence of the Fibonacci 38.2% one-week, SMA50 one-hour and Bollinger Band four-hour Middle at $1803.
The next relevant cushion is seen around $1798-$1797, which is the meeting point of the Fibonacci 23.6% one-week, Fibonacci 38.2% one-day and Bollinger Band one-day Middle.
The last line of defense for gold bulls is aligned at $1790, where the Fibonacci 23.6% one-month converges with the previous day’s low.
Here is how it looks on the tool
About Technical Confluences Detector
The TCD (Technical Confluences Detector) is a tool to locate and point out those price levels where there is a congestion of indicators, moving averages, Fibonacci levels, Pivot Points, etc. If you are a short-term trader, you will find entry points for counter-trend strategies and hunt a few points at a time. If you are a medium-to-long-term trader, this tool will allow you to know in advance the price levels where a medium-to-long-term trend may stop and rest, where to unwind positions, or where to increase your position size.
Disclaimer: Information on these pages contains forward-looking statements that involve risks and uncertainties. Markets and instruments profiled on this page are for informational purposes only ...
more

