
Gold Price Forecast: Post-NFP Rally Met With Waning Bullish Momentum
Gold remains bid following the U.S. Non-Farm Payrolls (NFP) report, with the precious metal still tracking the upward trending channel carried over from August, but the recent strength appears to be sputtering as the Relative Strength Index (RSI) flops ahead of overbought territory.
GOLD PRICE FORECAST: POST-NFP RALLY MET WITH WARNING BULLISH MOMENTUM

The mood surrounding the U.S. economy appears to be changing as updates to the NFP report warn of slowing job growth, and Federal Reserve officials may adopt a less-hawkish tone ahead of 2019 as Chairman Jerome Powell insists that
It seems as though the Federal Open Market Committee (FOMC) is approaching the end of the hiking-cycle as the federal funds rate is ‘just below the broad range of estimates of the level that would be neutral for the economy,’ and waning expectations for above-neutral rates may heighten the appeal of bullion especially as the Atlanta Fed GDPNow model forecasts the growth rate to increase 2.4% in the fourth quarter of 2018 versus 2.7% on December 6.
With that said, the FOMC may come under increased pressure to deliver a dovish rate-hike on December 19, and Chairman Powell & Co. may endorse a more neutral forward-guidance for monetary policy as Fed officials show a greater willingness to tolerate above-target inflation over the policy horizon. In turn, diminishing bets for an extended hiking-cycle may keep gold prices afloat, but sentiment surrounding bullion remains skewed as the retail crowd continues to bet on a larger correction.
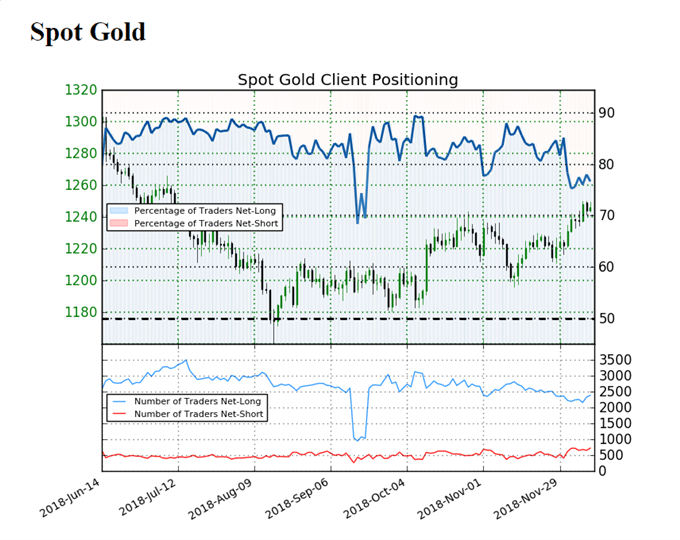
The IG Client Sentiment Report shows 76.7%of traders are net-long gold compared 82.3% at the end of November, with the ratio of traders long to short at 3.29 to 1. The number of traders net-long is 3.7% higher than yesterday and 7.0% higher from last week, while the number of traders net-short is 0.7% lower than yesterday and 6.0% higher from last week.
Despite the pickup in market participation, the ongoing tilt in retail interest undermines the recent advance in bullion as it offers a contrarian view to crowd sentiment. Keep in mind, the near-term outlook for gold remains supportive as the precious metal continues to track the upward trending channel from August, but the advance from the November-low ($1196) appears to be sputtering as the Relative Strength Index (RSI) flattens out and appears to have flopped ahead of overbought territory.
GOLD DAILY CHART
(Click on image to enlarge)
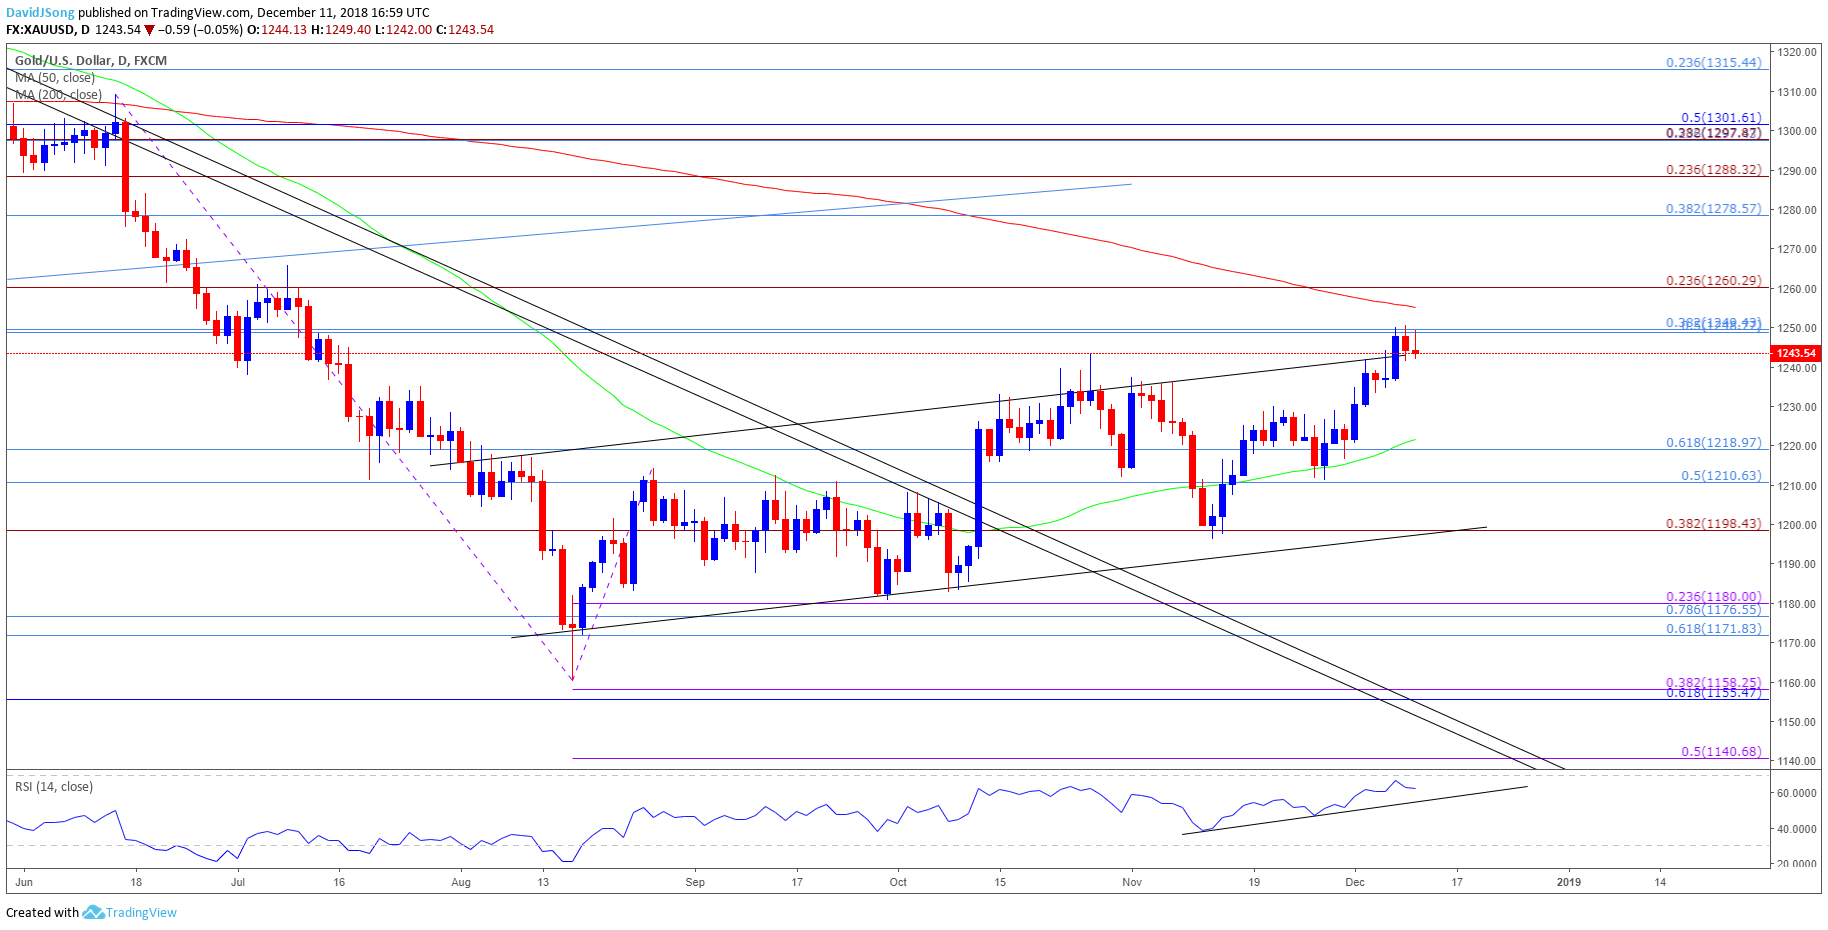
- Break of the October-high ($1243) keeps the topside targets on the radar for gold, but need a close above the Fibonacci overlap around $1249 (50% retracement) to $1250 (38.2% retracement) region to open up the next topside hurdle around $1260 (23.6% expansion).
- However, string of failed attempts to close above the stated region may spur a pullback, with the first area of interest coming around $1210 (50% retracement) to $1219 (61.8% retracement) followed by $1198 (38.2% expansion) area, which sits just above the November-low ($1196).
- Keeping a close eye on the RSI as it retains the upward trend carried over from the previous month, but the bullish momentum appears to be abating as the oscillator struggles to break above 70 and push into overbought territory.


