
Gold Price Forecast: Bulls Attempting Last Dance Ahead Of Jerome Powell?
Gold price (XAU/USD) fell for the third day in a row on Tuesday and tested the $1850 psychological support before recovering slightly to near the $1860 region. The US dollar found renewed strength amid rising expectations that US Federal Reserve (Fed) could lay out the foundation for monetary policy normalization on Wednesday, as it plans to keep its policy settings unchanged this month. The greenback strengthened even though the US Retail Sales data disappointed while Producers Price Index (PPI) bettered expectations. The downbeat mood on Wall Street and weaker Treasury yields helped limit the losses in the gold price. Despite the drop, the gold prices remained within Monday’s trading range.

Image Source: Pixabay
Heading into the FOMC showdown, the gold price is attempting a minor pullback, as the US dollar has stalled its advance, turning on the sidelines. Amid pre-Fed caution trading, gold is likely to keep its downside consolidative mode intact, although a brief rebound cannot be ruled amid repositioning. All in all, gold’s next directional move remains in the hands of Fed Chair Jerome Powell and his outlook on the economy, which will influence the American central bank’s next policy action. Patchy US labor market recovery could likely challenge Fed’s tapering expectations.
Gold Price Chart - Technical outlook
(Click on image to enlarge)
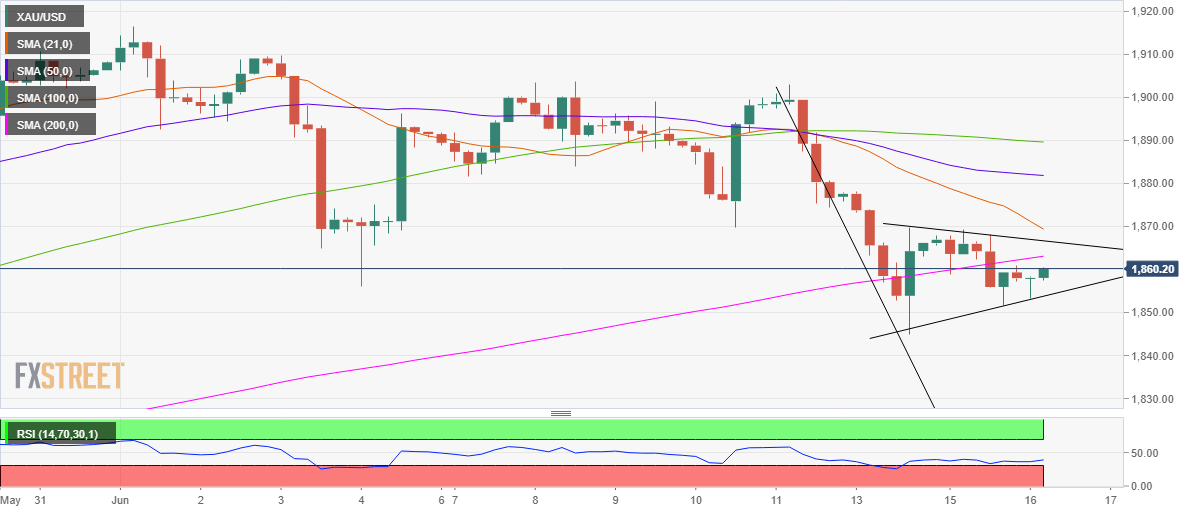
Gold: Four-hour chart
On the four-hourly chart, the gold price has charted a bear pennant ahead of the FOMC event. It’s a bearish continuation pattern and therefore, risks remain tilted to the downside for gold traders.
The Relative Strength Index (RSI) is trading listlessly below the midline while holding just above the oversold territory, suggesting that there is still some room left southwards.
Therefore, a sustained break below the rising trendline support at $1854 will validate the downside breakout, opening floors the 200-Daily Moving Average (DMA) at $1840.
Next on the sellers’ radars will be the May 14 low of $1820.
Alternatively, acceptance above the falling trendline resistance at $1866 will invalidate the bearish formation.
Further, if the FOMC disappoints the hawks, the gold price could rebound towards the previous daily support now resistance at $1879.
Ahead of that barrier, the $1870 static resistance and bearish 21-Simple Moving Average (SMA) on the four-hour chart could challenge the bullish commitments.
Disclaimer: Information on these pages contains forward-looking statements that involve risks and uncertainties. Markets and instruments profiled on this page are for informational purposes only ...
more

