
Gold Price Forecast: Bullish Momentum Unravels Following US GDP Report
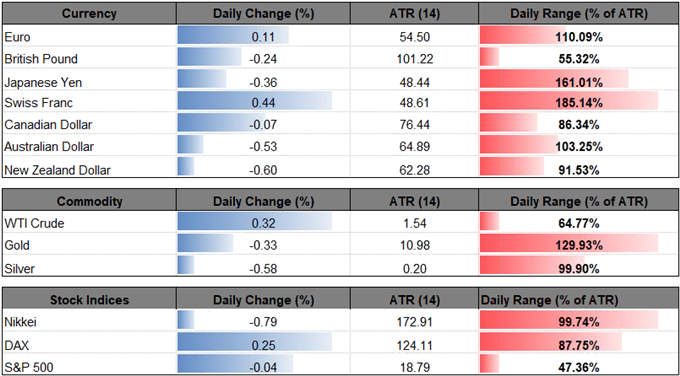
The price for gold slips to a fresh weekly-low ($1317) as the U.S. Gross Domestic Product (GDP) report shakes up the outlook for monetary policy, and the failed attempt to test the 2018-high ($1366) may generate a larger correction in the precious metal as the bullish momentum starts to unravel.
GOLD PRICE FORECAST: BULLISH MOMENTUM UNRAVELS FOLLOWING US GDP REPORT

Gold is back under pressure as fresh updates to the U.S. GDP report show the growth rate expanding 2.6% in the fourth-quarter of 2018 versus projections for a 2.2% print, and the developments may sway the outlook for monetary policy as the core Personal Consumption Expenditure (PCE), the Federal Reserve’s preferred gauge for inflation, unexpectedly climbs to 1.7% from 1.6% per annum during the three months through September.
The positive development may encourage Fed officials to squeeze in a rate-hike later this year as cycle as the central bank pledges to be ‘data dependent,’ but the ongoing shift in trade policy may encourage a growing number of Fed officials to adjust the Summary of Economic Projections (SEP) at the next meeting in March as U.S. Trade Representative Robert Lighthizer warns that ‘much still needs to be done before an agreement can be reached’ with China.
(Click on image to enlarge)
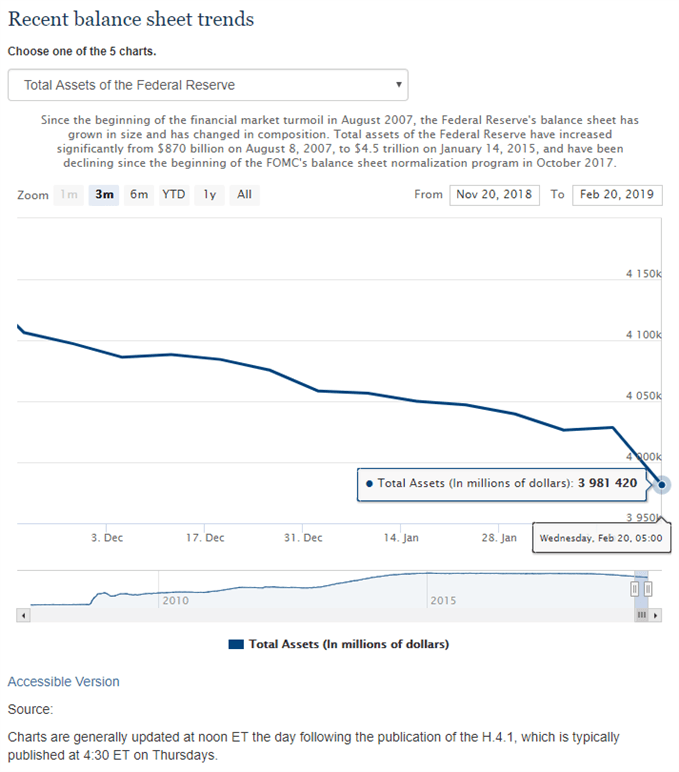
In turn, the Federal Open Market Committee (FOMC) may continue to change its tune over the coming months amid the ‘crosscurrents’ clouding the economic outlook, and the stronger-than-expected GDP print may do little to revive the hawkish forward-guidance for monetary policy as Chairman Jerome Powell warns of ‘muted’ inflation. In fact, it seems as though the FOMC is preparing to taper the $50B/month in quantitative tightening (QT) as Chairman Powell states that ‘the Committee can now evaluate the appropriate timing and approach for the end of balance sheet runoff,’ and the change in the monetary policy outlook may continue to heighten the appeal of gold as the central bank appears to abandoning the hiking-cycle.
With that said, the broader outlook for bullion remains constructive, but the precious metal may stage a larger pullback over the coming days as the bull-flag appears to have run its course. At the same time, recent developments in the Relative Strength Index (RSI) suggest the bullish momentum will continue unravel as it falls back from overbought territory and snaps the upward trend from late-last year.
GOLD DAILY CHART
(Click on image to enlarge)
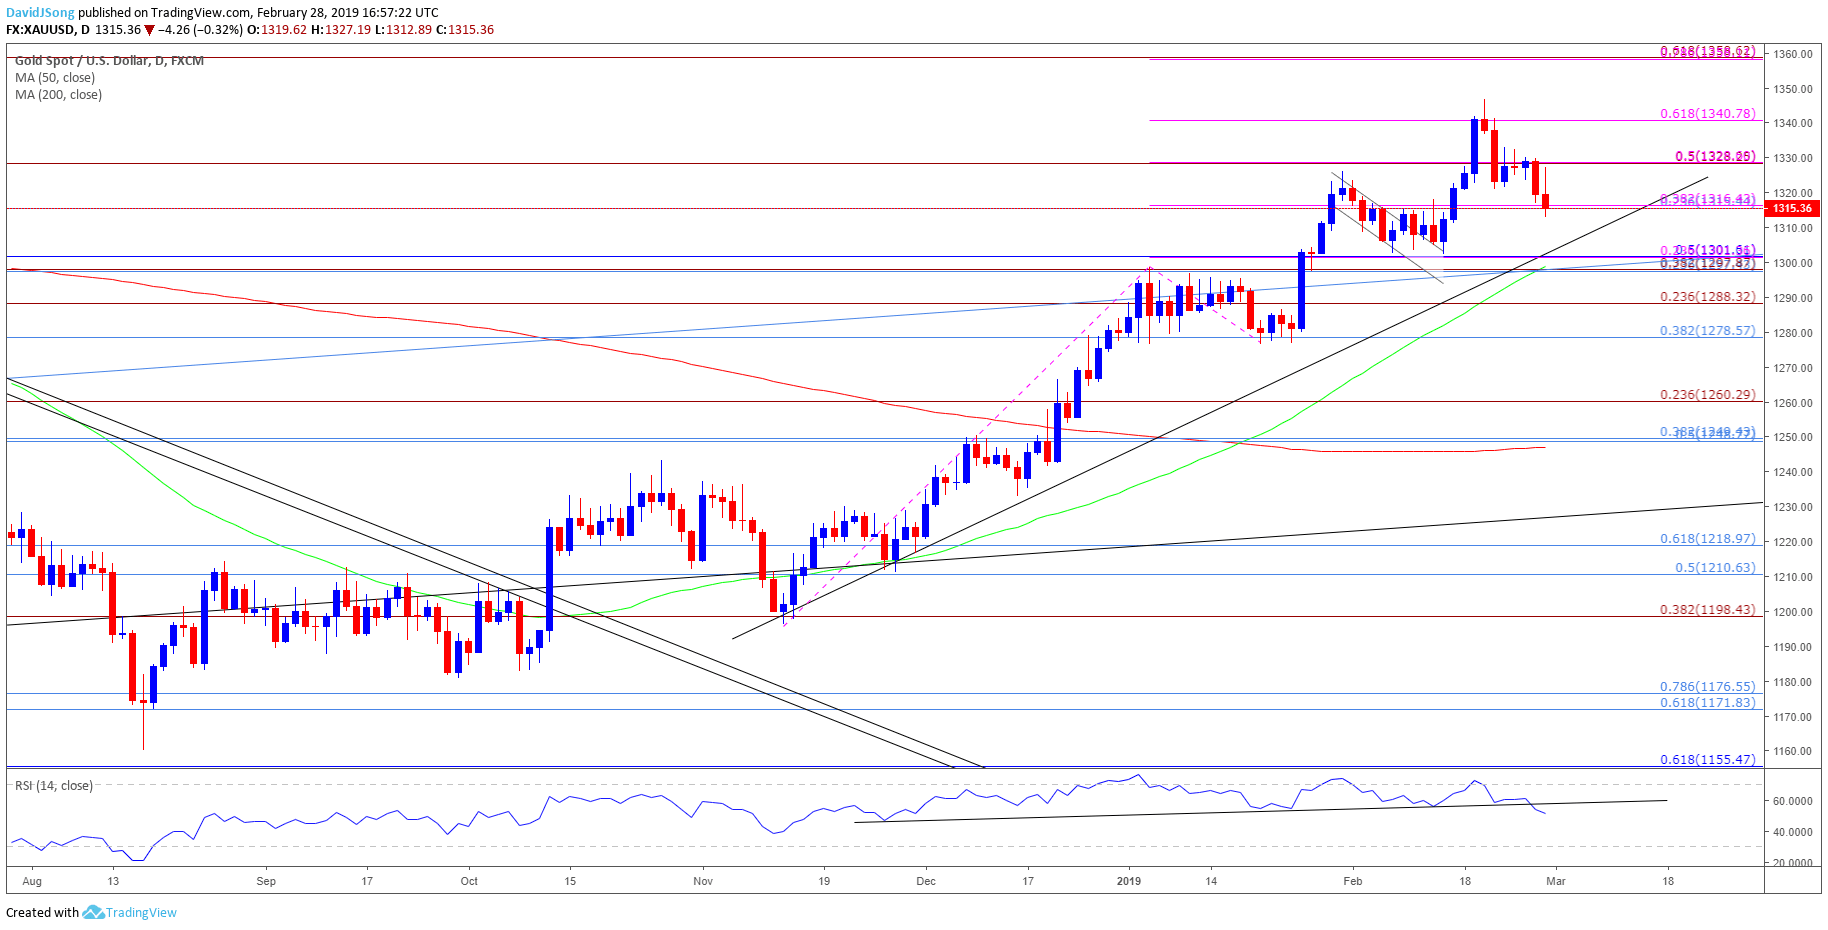
- Lack of momentum to test the 2018-high ($1366) may spark a larger correction in gold, with the recent development raising the risk for a further decline as the price for bullion initiates a series of lower highs & lows.
- In turn, a close below the $1315 (23.6% retracement) to $1316 (38.2% expansion) region brings the former-resistance zone around $1298 (23.6% retracement) to $1302 (50% retracement) on the radar, with the next region of interest coming in around $1279 (38.2% retracement) to $1288 (23.6% expansion).


