
Gold Price Analysis: XAU/USD Eyes $1874 And $1870 As Next Downside Targets – Confluence Detector
Gold price is falling from just below the $1900 area this Monday, kicking off the week on a bearish note. Resurgent US dollar demand amid a rebound in the Treasury yields, courtesy of US Secretary Janet Yellen’s optimism over the economy, weighs on gold’s appeal. Yellen said that higher interest rates would be a ‘plus’ for the Fed. Investors shrugged off dismal US NFP jobs data, as Yellen revived taper talks. Further, a tussle between the White House and Republicans over President Joe Biden’s $1.7 trillion infrastructure spending bill also adds to the downward pressure on the gold price.

Image Source: Unsplash
Looking ahead, the broader market sentiment and dynamics in the yields would continue to play out amid a lack of relevant US economic news. The US CPI report due on Thursday will be the main event to watch for fresh trading opportunities in gold price.
Gold Price: Key levels to watch
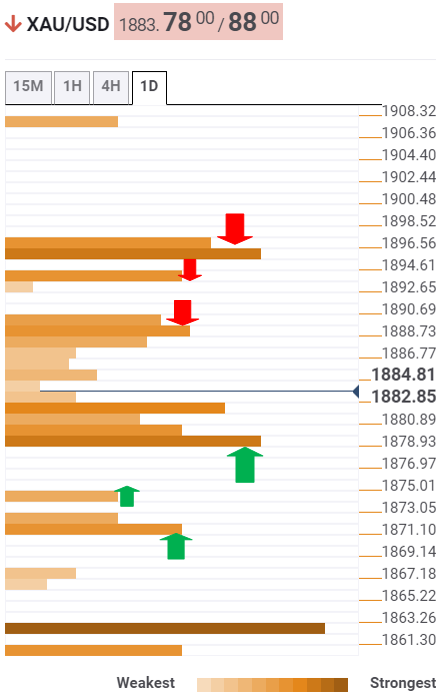
The Technical Confluences Detector shows that gold price is approaching a dense cluster of support levels stacked up around $1880.
At that point, the Fibonacci 38.2% one-month, Fibonacci 23.6% one-week and Fibonacci 38.2% one-day coincide.
If that cap gives way, a drop towards the Bollinger Band one-day Middle at $1874 cannot be ruled out.
Further south, the sellers will then test the confluence of the Fibonacci 23.6% one-week and Fibonacci 61.8% one-day at $1871.
On the flip side, gold bulls need to scale the $1888-$1890 supply zone on a sustained basis. That area is the convergence of the SMA5 four-hour, SMA10 one-hour and previous four-hour.
The Fibonacci 61.8% one-week at $1893 could test the bullish commitments.
The next stop for gold bulls is seen at $1896, where the previous day high, SMA50 four-hour and SMA200 one-hour meet.
Here is how it looks on the tool
About Technical Confluences Detector
The TCD (Technical Confluences Detector) is a tool to locate and point out those price levels where there is a congestion of indicators, moving averages, Fibonacci levels, Pivot Points, etc. If you are a short-term trader, you will find entry points for counter-trend strategies and hunt a few points at a time. If you are a medium-to-long-term trader, this tool will allow you to know in advance the price levels where a medium-to-long-term trend may stop and rest, where to unwind positions, or where to increase your position size.
Disclaimer: Information on these pages contains forward-looking statements that involve risks and uncertainties. Markets and instruments profiled on this page are for informational purposes only ...
more

