
Gold: Inflation Is Accelerating
Fundamentals
We do not know the total damage that the pandemic has caused to the economy. We do not know how many evictions are coming. The real estate market is on fire with migration from big cities to smaller, cheaper areas. Pent-up demand and increased printing of money is going to lead to inflation. We already see inflation in soybeans. We talked about soybeans back in March and now they are up about 50% from $8 to $12 a bushel. Food is bound to see inflation in prices. Soybeans are used in many foods as well as various industrial purposes. Soybean meal is fed to animals and for human consumption, while soybean oil also has many uses. Therefore, soybeans are an indicator of the future cost of food. Corn went from $3 to $4.29 a bushel. Wheat went from $4.71 to $6.38. Gold went from $1450 to $2089. All are signs of inflation. We see a combination of pent-up demand and a broken supply chain, leading to inflation. Reinforcing both those factors is the massive printing of money by the government. Stocks related to home improvement and lumber are also shooting up as demand increases and supply chain issues continue.
As vaccines are developed and become available, it is bullish for gold because as the economy comes back, everyone will want to travel, renovate their home, travel and spend, spend, spend. Therefore, demand will sharply increase, leading to shortages and inflation. Stocks are rising fast. Stocks have not corrected and now they are poised to make new highs. We are beginning to head back into possibly a normality economically. Once we are certain we have a vaccine, things are going to slowly get back to normal.
But there is still a lot of risk involved. We are going to have to closely watch the Fed’s position. Inflation is already here. Prices are already rising. The government has already printed trillions of dollars in stimulus. It’s just a matter of time before the market recognizes that inflation is here, and then we will be seeing $3,000 gold.
We welcome this correction in gold and we believe it is a great opportunity to add to your long-term position in gold.
The Biden administration will implement the proper stimulus package that is being demanded by the market. The stimulus is only one factor affecting the price of gold. The bigger picture includes the need for stimulus in almost every country on earth. If not, then the markets could collapse and we could be in a deep depression. Based on current leaders and policies, they will continue to increase stimulus as much as needed. The printing numbers, if anything, are going to expand exponentially. If inflation reaches 2% according to their formula. If we do see an inflationary spike, it will put tremendous pressure on the record debt around the world. Policies will be implemented to control the rise in interest rates. Debt is above 100% of GDP in many countries. The world’s economic leaders are planning to do a reset of the world economy. Part of that will be to increase debt. We may see the beginnings of a virtual currency. The key issue in relation to gold is whether they use any kind of backing on a new virtual currency. Gold might serve as a backing for a virtual currency and be a way to get out of the current reliance on fiat paper currencies. If they do, it would increase trust in that virtual currency. Virtual currencies are less than a decade old, so they are not going to replace gold. However, if they link such currencies to gold, it could provide a virtual currency with the much-needed credibility to be broadly accepted.
With such issues at stake, it is one of the most exciting times in our lifetimes. This could be a life-changing situation for you and your family. Gold is offering an excellent opportunity to provide a financial foundation for your future.
Technical Analysis
Gold is in a fast market. It is trading last at $1802.90. We are long gold at $1800 from the Buy 2 level according to the Variable Changing Price Momentum Indicator (VC PMI). You can use $1799 as your protective level or a dollar stop to suit your profile. A close above $1799 activated a buy signal on the close at $1803. The target above is $1817 for day trading. This is an area with the strongest probability of buyers coming into the market. The mean is $1847, so we are below that mean and the market is extremely oversold. The VC PMI predicts that there is a 90% probability of a reversion back up to $1817 unless we close below $1799 using the 15-minute bar.
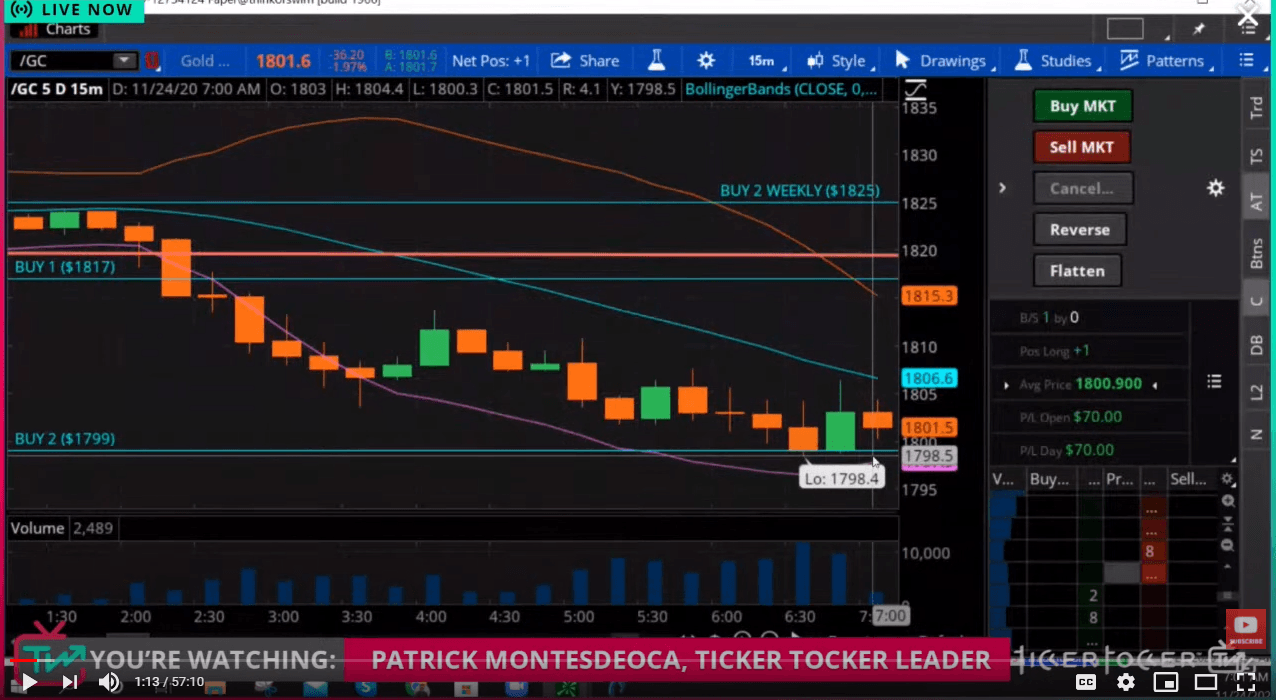
Courtesy: Ticker Tocker
Coming down to $1800 is a critical level. Gold has come down about 50%, a Fibonacci retracement, from $2089 back on August 7, 2020. We are tapping into the Buy 2 level of the daily, which is at $1799. The first target above is $1817, which is the Buy 1 level.
When the VC PMI daily and weekly levels match, it is a harmonic alignment. If the market reaches those levels, the probability of a reversion to the mean is much higher. Since we are trading below $1825, that weekly level has now become resistance. The monthly Buy 1 level is $1846, which has become resistance, too. If we close above $1846, it will activate a bullish monthly trend momentum. We may get a short-covering rally or a new trend signal. The market’s sentiment has turned extremely bearish.
We are trading under the 200-day moving average, which is an indication of the long-term sentiment of the market. When the market reaches those averages, that is the time to cover the previous trend. If gold comes down to that 200-day moving average, then the pattern from above is completed.
For the monthly VC PMI signals, the Buy 2 level is $1812, so the market is very oversold. If we close above $1812, we will activate a monthly buy trigger. It will also activate again the annual bullish price momentum, which is at $1810. If we look at the 9-year cycle, the average price is $1675. The Buy 1 level of the 360-day cycle is $1532. Since the market is trading at these levels has brought into play the levels below. The market is likely to revert from these levels to go back up as buyers are identified and to close above $1812.

For the December gold contract, we have entered into the blue zone where buyers are likely to come into the market. According to Elliott wave analysis, a second wave correction will be completed at 1740 - 1750 levels. This could be the beginning of the third wave. The high we made in August from the low of $1450 is the first wave. The first leg was about a $600 move up. Then the market consolidated after the high was made, which is considered the second wave. If we look at Fibonacci retracements from the low of $1450 to the recent high $2089, then we have a 50% Fibonacci at about $1771. That usually satisfies the completion of the second wave. We do not think that the market has shifted from the picture of a big bull market. We are looking at a historic gold market unfolding. If we expand this pattern and use Elliot wave counts, after the second leg correction, the third leg can be double the first leg. The second leg is usually within a 50% retracement or less. Once the bottom is identified, we could be looking at a $1200 move with $3000 gold as the target on the third Elliot wave.
The market appears from an Elliot wave point of view the second wave correction or B wave is being completed. The targets are the VC PMI Buy 1 level of $1817, Buy 2 of $1799, and the 360-day cycle average price of $1810. Now we are waiting for the market to identify the bottom. A close above $1817 would identify the bottom, which would bring in all the other monthly signals and activate daily and monthly long trigger points.
Disclosure: I am/we are long GDX. I wrote this article myself, and it expresses my own opinions. I am not receiving compensation for it (other than from SA). I have no business relationship ...
more

