
Gold Finds Footing, Fed Speak Stewing
No sooner had we penned last week's piece ("Gold Drops Exceedingly; Fed Ducks Reality") wherein was written with respect to the Fed...
"...That they see two Fed Funds rate increases the by end of 2023? How about by the end of this year?..."
...when (cue Fed Speak) up popped St. Louis Fed Prez James "Bullish" Bullard stating inflation is more than they'd just expected, such that a rate hike may come next year. Then chiming in with same came Atlanta Fed Prez Raphael "Ready to Raise" Bostic. At the same time, Minneapolis Fed Prez Neel "Keep Cash a-Comin'" Kashkari says they can slide without a rate rise beyond 2023. (Is that deflationary-depression-speak?) Too, New York Fed Prez John "It's All Good" Williams still leans to keeping the spigots open. Stewing away are the Fed Prez!
Still, diplomatically maintaining equilibrium is Federal Reserve Chairman Jerome "Please 'Em All" Powell pointing out to Congress that whilst the economy has shown "sustained improvement", it nonetheless has "a long way to go". (See further down our Econ Baro).
'Course going down Mexico-way, they're not waiting another day, Banxico boosting their lending rate by 0.25% (to 4.25%), their first increase in two years.
But the week's real kicker was Treas Sec Janet "Old Yeller" Yellen stating with hat-in-hand to Congress that the USA defaulting on its DEBT would be "unthinkable"; (that really would wreck stock markets right 'round the world). Nothing like issuing DEBT in perpetuity, eh? "Got Bonds?" We hope not. "Got Gold?" We hope so.
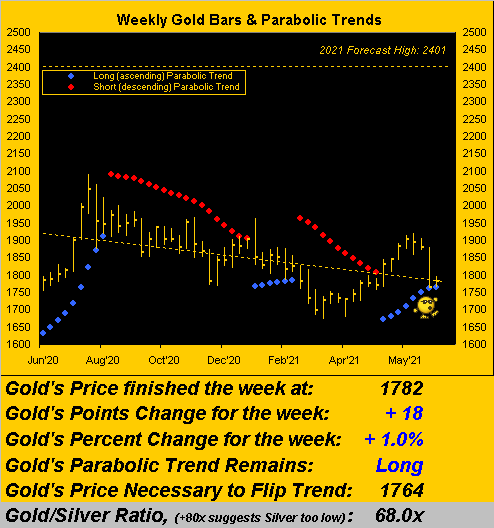
And indeed with all the Fed Speak and weaker economic data throughout the week, Gold -- the recent decline for which was well overdone -- finally found some footing, albeit narrowly so. Gold's "expected weekly trading range" for that just past was 57 points: but only a range of 32 points actually was traded, second narrowest year-to-date. Moreover as we go to Gold's weekly bars from a year ago-to-date, the present parabolic Long trend is still barely in place, price needing to stay above 1764 in the new week to avoid such trend flipping to Short. But the broad trend as measured by the diagonal dashed line has rotated a tad more negatively:
And comparatively across the five primary BEGOS Markets (Bond / Euro / Gold / Oil / S&P) from one month ago-to-date, Gold (-6.5%) is the weakest of the bunch, whereas Oil (+10.4%) is firmest:

As a further reminder, Gold (GLD) would like to see the Fed get on with raising its Funds rate, for as history shows, the yellow metal can do very well when Fed Funds rise from nothing as again we reprise this chart from the three-year 2004-2006 stint:

So with the Fed now stewing in a bit of a pie-fight as to when to raise rates and engage in paper taper, let alone agree on the state of the Stateside economy, we understand it quite clearly via the Economic Barometer, which looks to be commencing a fresh decline:

Indeed from this past week's rash of incoming metrics, only May's Durable Orders showed any improvement, and just mildly at that. Otherwise, the month's Home Sales (both Existing and New) missed their April levels, Personal Income remained negative with Spending flat, and the Fed's favoured gauge of inflation growth -- the Core Personal Consumption Expenditures Index -- came in slower than April and milder than anticipated. Again as we've said: the expected economic boom "has already happened." Let's see what next week's 13 data items do to the Baro.
As for the S&P 500 -- which no longer goes down -- the 4300 level is within Monday's "expected daily trading range". And perhaps 5000 before year-end? Why not. Our "live" price/earnings ratio is a mere 56.6x. Do you pay $56 for something that earns $1? Of course you do: all day long! Making money has never been easier. (One wonders if those airhead Fin Media TV networks could be litigated for "financial libel"). (SPX, SPY) Again: "Got Gold?"
We do here on the left in the following two-panel graphic of the precious metals' daily pricing from three months ago-to-date, Gold's "Baby Blues" of linear regression trend consistency careening down to their -80% axis. But upon them curling up from that level, 'twill be an early indication of the trend turning positive. For Silver on the right the assessment is the same:

Now for their respective 10-day Market Profiles, you can readily see the "footing" to which we allude in this week's title. For Gold (below left) the key hold area is right here in the current 1783-1778 zone, whilst for Sister Silver (below right) 'tis between 26.25 and 26.00 (SLV):

To wrap, in that we can't get through an edition of The Gold Update without bemoaning the S&P's horrendous overvaluation which we above cited, here's a plus (ha!) and a minus toward it all ultimately unraveling.
The Plus: According to Fed stress tests, shareholders can jump for joy as the banks in which they invest can tolerate some $500bn of loan losses. So bring on the share buybacks! "We don't need no margin for error!"
The Minus: The in-thing to do these days if you're a publicly-traded company with no earnings, lots of debt and no competitive edge is to sell more stock. 'Tis basically accepted now that folks will blindly buy your shares. "We're stuck on stooopid and don't even know it!"
'Course, you shan't ever be stuck -- royal right or otherwise -- given you've got Gold!
Disclaimer: If ever a contributor needed a disclaimer, it's me. Indeed, your very presence here has already bound you in the Past, Present and Future to this disclaimer and to your acknowledging ...
more

