Gold And The Boom-Bust Cycle
The true fundamentals* have been trending in a gold-bearish direction since early-October of last year, which is a large part of the reason that the gold price has been in a downward trend for the past several months. The majority of these true fundamentals are measures of confidence in the economy and/or the banking system, the theory — which is supported by decades of empirical evidence — being that gold performs relatively well in the bust phase of the boom-bust cycle and relatively poorly in the cycle’s boom phase.
Just to be clear, if the US$ is weak enough then it certainly is possible to make gains in US$ terms via being long gold during a boom, but you will do better by being long other things including industrial commodities. Hence the use, above, of the word “relatively”.
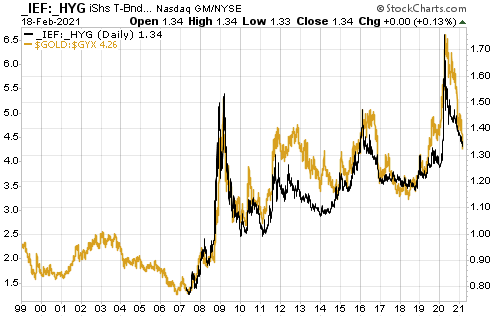
Credit spreads are one useful measure of economic confidence, with widening spreads indicating falling confidence and narrowing spreads indicating rising confidence. This implies that the direction and level of credit spreads indicate whether the economy is in the boom phase or the bust phase. That’s why the gold/commodity ratio generally has trended up and down with credit spreads, which is exactly what it should do.
Below is a chart that illustrates the relationship mentioned above. In this case, metals are being compared with metals by looking at how gold performed relative to industrial metals (represented by the Industrial Metals Index – GYX) during periods of widening and narrowing credit spreads.
Unfortunately, the data for the credit spread indicator used in this chart starts in 2007, so for the first eight years of the chart, there is only the gold/GYX ratio. However, a longer-term credit-spread indicator would confirm that gold/GYX’s 2001-2002 upward trend coincided with an economic bust and gold/GYX’s 2003-2006 downward trend coincided with an economic boom.
The chart suggests that there was a major economic boom during 2003-2006 and major economic busts spanning mid-2007 to mid-2009 and Q4-2018 to March-2020. The period from mid-2009 through to Q3-2018 contained a series of relatively minor booms and busts.

My guess is that the current boom will be short by historical standards, but there is no need to guess correctly because real-time data will provide timely warnings that the transition from boom to bust has begun. Right now there is no evidence that the boom is over.
*I use the term “true fundamentals” to distinguish the actual fundamental drivers of the gold price from the drivers that are regularly cited by gold-market analysts and commentators. According to many pontificators on the gold market, gold’s fundamentals include the volume of metal flowing into and out of the inventories of gold ETFs, China’s gold imports, the volume of gold being transferred out of the Shanghai Futures Exchange inventory, the amount of “registered” gold at the COMEX, India’s monsoon and wedding seasons, jewelry demand, the amount of gold being bought/sold by various central banks, changes in mine production and scrap supply, and various manipulation stories including wild guesses regarding JP Morgan’s exposure to gold. These aren’t true fundamental price drivers. They are distractions (at best) and should be ignored.
This blog post is a modified excerpt from a commentary published at TSI on 21st February.


