
Gold ABC Zigzag Pattern In Bullish Wave 2
Gold (XAU/USD) could have completed a wave 4 (blue) pattern at the most recent low. But price action will need to stay above the bottom to confirm the end of the correction.
Will the uptrend continue? Let’s review the chart patterns to answer this question.
Price Charts and Technical Analysis
(Click on image to enlarge)
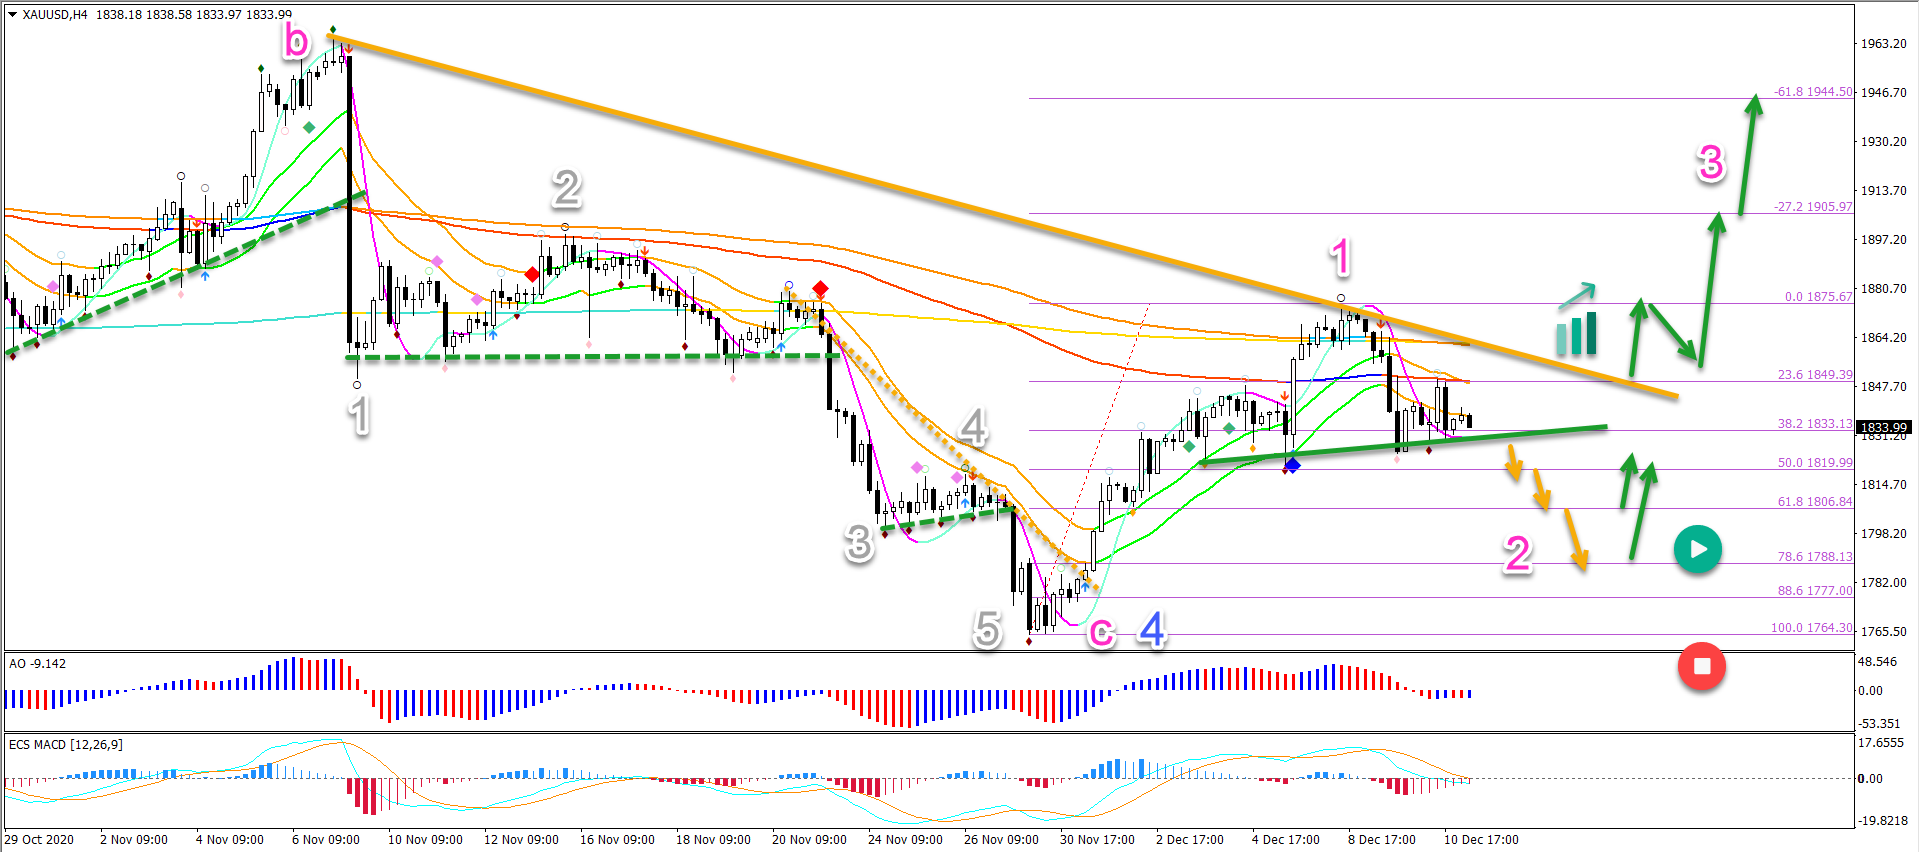
The bullish push is indicating a potential reversal. The impulsive price swing looks strong and suggests that the old uptrend has returned.
However, before the uptrend is back, a bearish break below support (green) seems imminent. Especially because the moving averages are bearishly aligned.
- If this is a wave 1 (pink), then the current retracement should be a wave 2 (pink).
- This becomes invalid if price action breaks below the bottom (red circle).
- A bullish bounce at the Fibonacci levels could confirm the end of the wave 2.
- A break above the resistance trend line (orange) confirms the uptrend and wave 3.
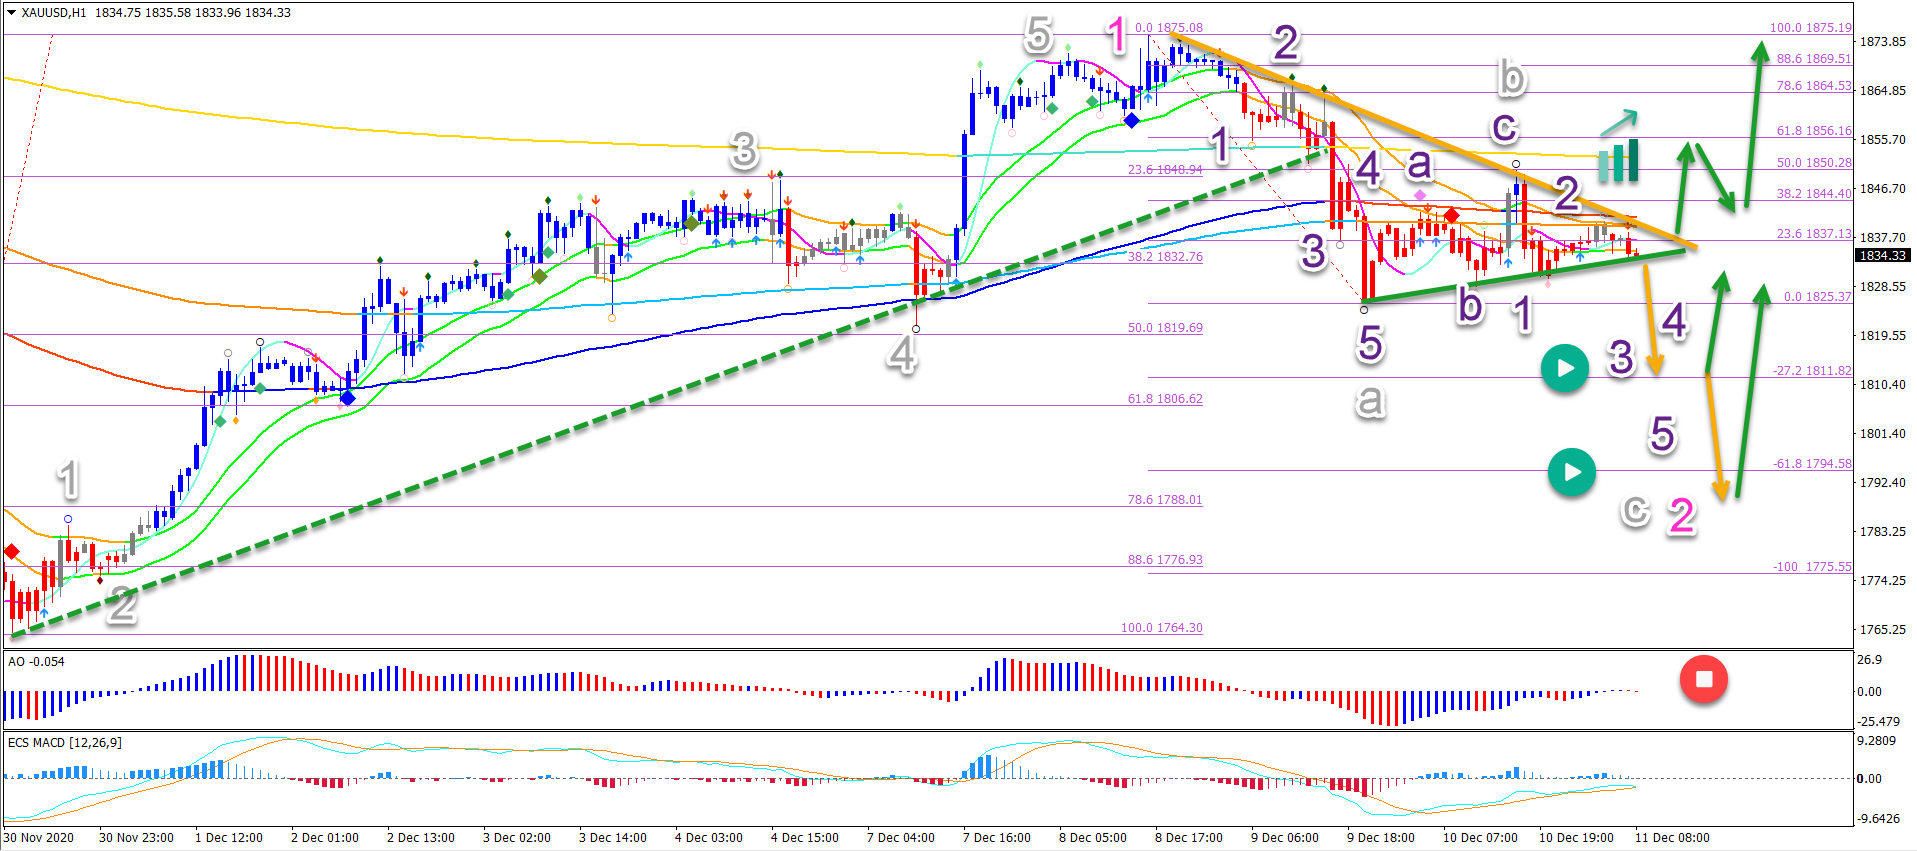
On the 1 hour chart, price action seems to be building an ABC (grey) zigzag pattern:
- Within the wave A (grey), there were 5 waves (purple) completed.
- Also, the wave B (grey) respected the 50% Fibonacci.
A bearish breakout could confirm the wave C (grey). But price action must stay above the bottom and 100% Fibonacci to preserve the uptrend.
(Click on image to enlarge)
Disclaimer: The opinions in this article are for informational and educational purposes only and should not be construed as a recommendation to buy or sell the stocks mentioned or to solicit ...
more

