
Gold & Silver Headed For Bigger Correction?
While I did not expect the metals’ rebound to lead to a breakout, I was a bit too sanguine in my last article.
I did note the potential for a US Dollar rally, which is underway, but should have stressed Silver’s stiff resistance at $27-$28 and in Gold at $1960. The failure at these levels likely indicates metals won’t break to the upside this winter.
Nevertheless, there are some positives.
For the most part, since August 2020, Gold and gold stocks have been correcting, so plenty of capital has already exited the sector. To a good degree, the markets have already discounted rising bond yields and potential economic recovery.
Also, note that precious metals performed well during the first year of the most recent economic recoveries (2003, 2009).
The primary trend will remain higher as the yield curve continues to steepen, and real interest rates are pressured lower due to rising inflation.
However, we do need to follow the technicals of the market.
Gold has put in a significant weekly reversal, and $1900 and $1950 especially will be stiff resistance levels moving forward.
The key support levels are the November 2020 low at $1770 and $1690. The 300-day moving average, a level that provided support many times during Gold’s run in the 1970s and 2000s, is at $1740 and rising.
(Click on image to enlarge)
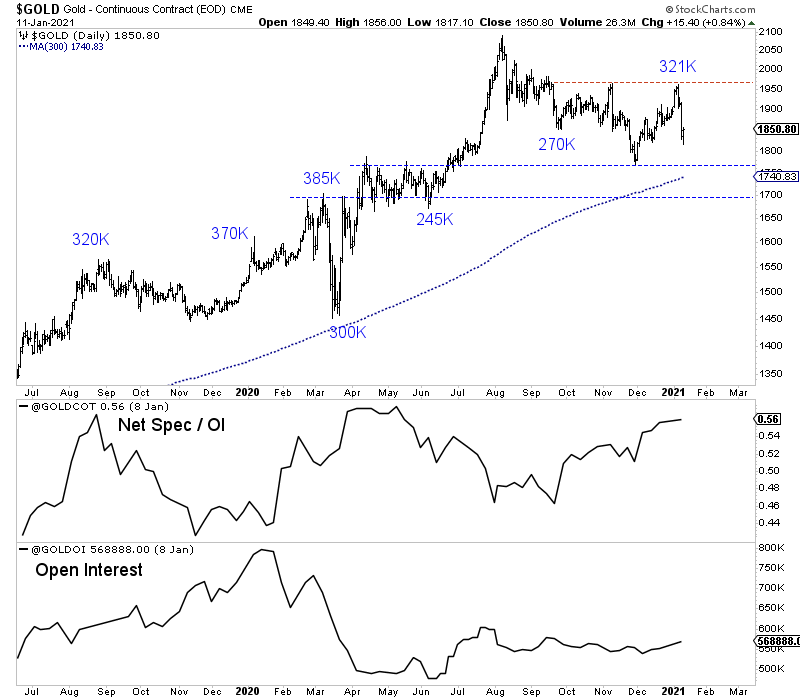
Gold Daily Bars w/ CoT (net specs in blue)
Silver’s key support levels are at $22 and $21. The $27-$28 area is very stiff resistance based on the monthly and quarterly chart.
(Click on image to enlarge)
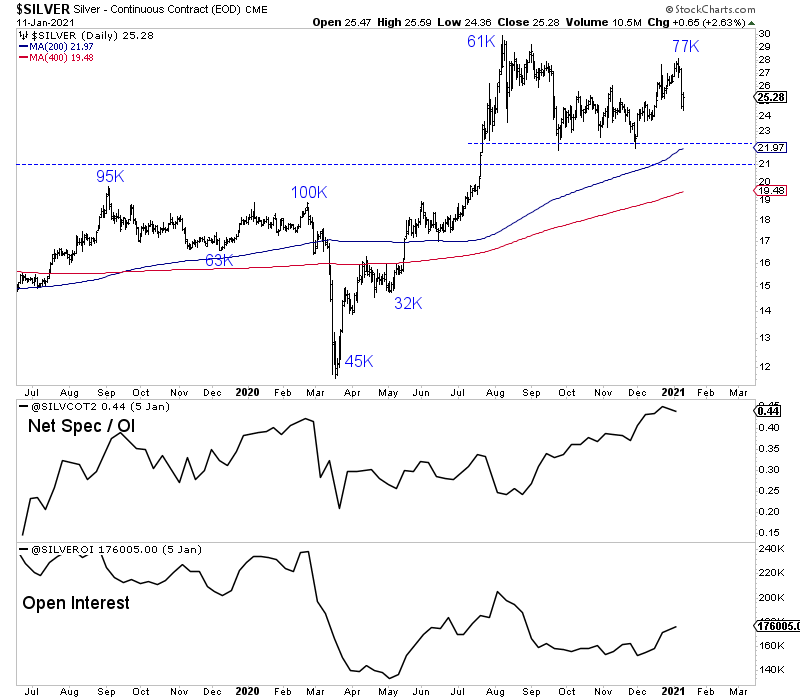
Silver Daily Bars w/ CoT (net specs in blue)
Moving forward, price action, intermarket analysis, and sentiment indicators (net speculative positions in blue) will help us anticipate the next low and potential for a sustained rebound.
Turning to the miners, we see they have strong support around the previous 8-year resistance, as well as some moving averages.
During the bull market years of the 2000s, the 400-day exponential moving average provided support (for GDX and its parent index) during many corrections. That moving average is 8% below Monday’s close.
GDXJ should have strong support at its previous 8-year resistance and its simple 400-day moving average, which is only slightly lower.
(Click on image to enlarge)
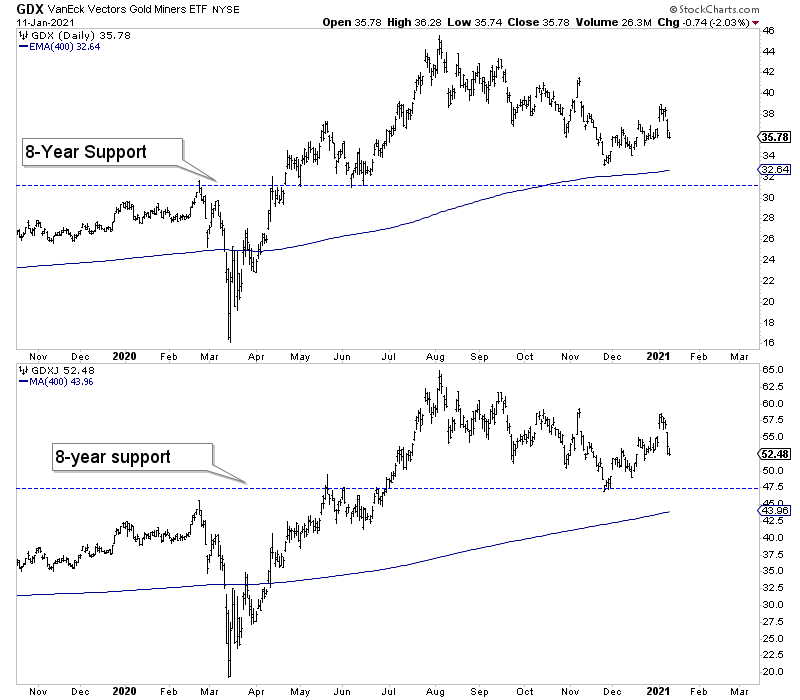
GDX (top) & GDXJ (bottom)
Given last week’s huge reversal, the path of least resistance over the near term figures to be lower.
However, it’s important to note that metals and miners have corrected for most of the past five months. There may be some selling pressure left but not a significant amount.
Thus, another leg lower could be the final leg of a larger correction that began last August 2020.
In any case, exercise a bit of patience and keep an eye on these support levels as they could mark very good entry points in many stocks.
Disclaimer: TheDailyGold.com and TheDailyGold Premium are not investment advice. The website, email newsletter and premium newsletter are ...
more

