
Global Stock Valuations: What Does The Buffett Indicator Say?
Two weeks ago, I wrote about Warren Buffett’s favorite tool for measuring the overall valuation of the market: the ratio of total market cap to GDP. Today, we’re going to dig a little deeper into that analysis and compare the US market to some of its peers overseas.
First, a few caveats. There is no “correct” ratio of market cap to GDP or any formula that suggest what ratio is optimal. This is very much a relative value analysis in which we can compare a given market to its peers and to its own history.

Also, some countries will naturally have a much higher ratio than others. For example, Switzerland is a tiny country with several massive global banks and multinational companies that get the vast majority of their revenues from outside Switzerland. So, a ratio that would seem absurd in the US, UK or France would be perfectly reasonable in Switzerland.
Finally, we should remember that historical data has to be viewed in context. Yes, Japanese stocks today might look cheap when compared to the valuations of the late 1980s. But that was also one of the biggest stock bubbles in world history and one that we should never expect to see repeated in our lifetimes.
So with no more ado, let’s jump into the data. The chart below, courtesy of GuruFocus, shows the current market-cap-to-GDP ratio (in blue) within the context of its historical range (blue and green combined).
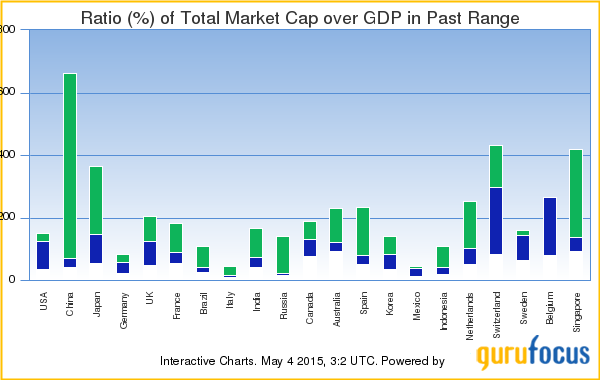
As you can see from the chart, the US ratio is just a hair’s breadth below the all-time highs set during the 1990s tech bubble. But Chinese stocks would at first seem to be an outright steal. Be careful in how you interpret this data, however. China’s historical range includes bubble valuations a decade ago that we cannot expect to be repeated. And China may also be facing a destabilizing hard landing after three decades of monster growth. Still, even with all of that considered, Chinese stocks are some of the cheapest in the world by this metric.
Japanese stocks also at first look cheap based on their historic range, but as I mentioned earlier their history is not one that is likely to be repeated. And Japanese stocks are actually slightly more expensive than American stocks as a percentage of GDP…and this despite all of the macro challenges Japan faces. Anyone who tells you Japanese stocks are cheap has a very poor understanding of Japan.
If there is any pocket of the world that looks cheap, it would be Europe. Most European countries look cheap both in comparison to the US market and in comparison to their own historical ranges. Europe has its share of problems, of course. Greece may still default, and the Eurozone still faces a long road to recovery. But based on Warren Buffett’s favorite macro indicator, European stocks offer the best value in the world at today’s prices.
Disclosures: None.
Disclaimer: This article is for informational purposes only and should not be ...
more

