
Global Manufacturing PMI Falls To A 21 Month Low
Global Manufacturing PMI Falls
Global Manufacturing PMI - Weakness in trade growth is expected. The JP Morgan global manufacturing PMI has been declining as you can see in the chart below. The input prices index has been elevated since mid-2017. New orders, headline PMI, and output have been declining since the winter of 2018.
This report gives America a 22.2% weighting which is the highest. Keep in mind Markit has American manufacturing weakening. China is second at 11.9%; Japan is third at 7.6%, and Germany is fourth at 4.9%.
(Click on image to enlarge)

Global PMI fell from 52.8 in July to 52.5. Output increased slightly from 53 to 53.1. Keep in mind, everything above 50 means growth. All the segments were above 50.
New orders were down from 52.6 to 52.4. New exports were flat at 50.3. Employment fell from 51.9 to 51.6. Even though input prices have been running hot, they cooled slightly in August as the index fell from 61.5 to 61.3; output prices also fell as the index went from 54.4 to 54.3.
Finally, the future output index fell from 62 to 61.7. There weren’t any massive changes.
Global Manufacturing PMI - 6 out of 8 indexes fell, signaling the deceleration in global manufacturing continued in August.
Even though August manufacturing PMI hit a 21 month low, global manufacturing growth is near a 3% annualized pace.
PMI has been above 50 for 30 straight months. The only PMI’s which were below 50 were Turkey, Russia, South Korea, Thailand, and Myanmar.
Emerging markets did worse than developed markets. China was at 50.6 which is the lowest PMI in 14 months. Brazil was at a 4 month high and India showed weakness.
This is different from other data I’ve reviewed over the intermediate term as Brazil is still weak and India is one of the strongest economies in the emerging market category.
Global Manufacturing PMI - And the Widening Trade Deficit
The widening trade deficit is bad for potential trade deals because President Trump wants the trade deficit to shrink. He could get tougher on tariffs when he sees higher deficits.
It’s also bad for GDP growth as imports hurt growth and exports help it. This report is one more example of why Q3 growth won’t come close to 5%. June’s trade deficit was revised from $46.3 billion to $45.7 billion.
July’s deficit widened to $50.1 billion which beat estimates for a $50.2 billion deficit. This is the widest deficit since 2015.
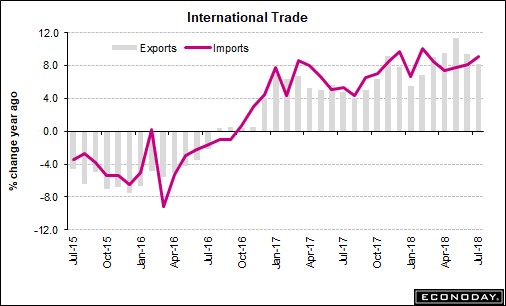
As you can see in the chart below, year over year growth is in the high single digits for exports and imports. Export growth has been slipping for 2 months, but import growth has increased.
(Click on image to enlarge)
The deficit in goods increased from $68.9 billion to $73.1 billion. The surplus in services declined to $23.1 billion. Exports of capital goods fell $1 billion to $46.3 billion as aircraft exports fell $1.6 billion to $3.5 billion.
Exports of foods and feed fell $0.9 billion to $13.2 billion. President Trump has been focused on trying to get trade partners to buy more from American farmers.
Since farmers have been hurt by the trade skirmishes, the President has granted them subsidies. Exports of capital goods fell $0.4 billion to $16 billion.
Imports of consumer goods fell $0.8 billion to $52.6 billion. Capital goods imports increased $0.7 billion to $58.2 billion and auto imports were up $0.5 billion to $30.7 billion.
Global Manufacturing PMI - Auto imports may crater if Trump implements a tariff on cars from Canada or Europe.
The trade deficit might improve depending on the tariffs put on American goods, but consumer spending would drop.
Consumers don’t always act rationally, but I would expect them to pull back on car buying because prices would increase and they would be uncertain about how to react.
The trade deficit with China increased to $36.8 billion which was a record. The EU deficit was $17.6 billion. Deficits with both Japan and Mexico were $5.5 billion. And, the deficit with Canada was $3.2 billion. Even though the Canadian deficit is smaller than the one with Mexico, a trade deal with Canada appears to be tougher to come by.
Even though Trump has recently talked tough on Canada, I think a deal will be struck by the end of the year because negotiations have gone far and a deal looks close.
Global Manufacturing PMI - Back To School Shopping Season Was Strong
The back to school shopping season from late-July to early-September is the biggest shopping period. This is outside of the Christmas shopping season which is from late-November to December.
This makes the Redbook same store sales report for the week of September 1st important. Same-store sales were up 6.5% as you can see in the chart below.
The numbers represent an increase from 5.1% growth in the prior week. This is the strongest growth rate in at least 13 years, signaling consumer spending is ramping.
(Click on image to enlarge)

The report looks like great news for the winter holiday shopping season and Q3 GDP growth. Month to date sales were up 0.4% and the full month year over year gain increased by 0.4% to 5.2%.
That’s the highest growth rate this year. Year over year growth is helped by easy comps. It’s still extremely relevant as the chart above shows Redbook same store sales growth is correlated with retail sales.
Global Manufacturing PMI - Retail sales growth has been strong recently.
The August report will be released on September 14th which is Friday next week. July had 0.5% month over month sales growth for the control group and 0.6% growth excluding autos and gas.
The strong earnings reports from major retailers and the great Amazon Prime day sales also provide support that the consumer is in great shape.
Global Manufacturing PMI - MBA Mortgage Applications
In the week of August 31st, the week over week change in the MBA composite index was -0.1%.
The purchase index was up 1% and the refinance index was down 1%.
Both categories improved 2% from the prior week’s growth rate. The average interest rate on 30 year fixed mortgages increased 2 basis points to 4.8%.
The housing market has been weak this summer. This report showing positive year over year purchase applications growth offers a small sign the housing market could be improving.
Disclaimer: Neither TheoTrade or any of its officers, directors, employees, other personnel, representatives, agents or independent contractors is, in such capacities, a licensed financial ...
more

