
Getting Creative In The Hunt For Yield
Interest rates remain near historically low levels. This is great for the economy and the financial markets. But it remains terrible for those who want or need investment income. As usual in situations like this, there’s temptation to reach for as much yield as can be obtained in today’s environment. And the challenge, as always, is to steer clear of “sucker yields,” yields that look high because of price declines that anticipate dividend cuts. With all income seekers looking for the same thing, we need creative ways to assess dividend risk. Here are sone ideas generated by Chaikin Analytics content.

© Can Stock Photo / venimo
The Approach
OK. We understand that we can’t simply sort equity-income candidates by yield and pick from the top. What we can do is look for ways to raise the self-imposed yield ceiling as high as possible consistent with an acceptable level of dividend-sustainability risk. And the better we are at assessing this risk, the better our ability to accept higher yields than would be palatable to many other dividend players.
I tackle this task by eschewing traditional approaches to risk assessment such as the payout ratio and relying instead on general fundamentals and even more, on chart reading and measures of market sentiment (or, put another way, by outsourcing dividend risk analysis to “Mr. Market,” who I’ve consistently seen, is remarkably skilled at assessing dividend risk. (Note to Ben Graham: In today’s information-rich era, it’s time to update the myth that postulated Mr. Market as a manic depressive loser.)
Here’s an approach that uses the Chaikin Power Gauge rating and the firm’s approach to chart analysis as described here.
Part One: Identify Attractive Equity Income ETFs
I started with the recently-introduced Chaikin ETF screener and identified U.S. Equity Income ETFs that had (i) bullish ETF Power Gauge ratings which are based on the ratings of the fund’s constituent holdings and technical analysis of the ETF price, (ii) yields of at least 3%, and (iii) Betas below 1.00.
The Chaikin database starts with 59 domestic equity income ETFs.
- Most, 44 of them, have Betas below 1.00, but it’s still a good idea to eliminate the 15 more volatile funds.
- Only 23 out of 59 have yields above 3%. When we also eliminate those with betas above 1.00, we’re at 21 candidates.
- If this were a stock screen, we might start here. But nobody needs to own 21 ETFs, each of which is a diversified (within its chosen style) portfolio unto itself.
- Limiting consideration to those with bullish Power Gauge ratings, we’re now down to 9 ETFs. That’s still more than many would want to own, but at least now, we’re down to the point where its feasible to look at them individually and hone in on those with higher yields (relative to the final 9) and favorable charts.
Here are the two I picked out:
Figure 1 – SPDR S&P 500 High Dividend ETF (SPYD)
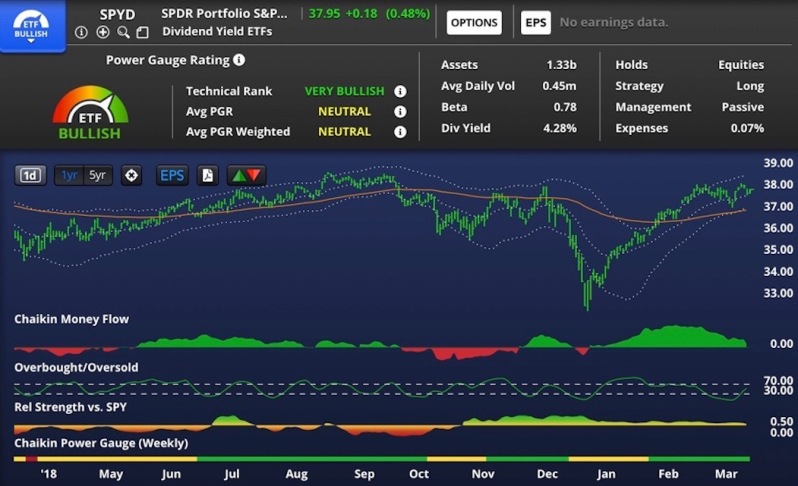
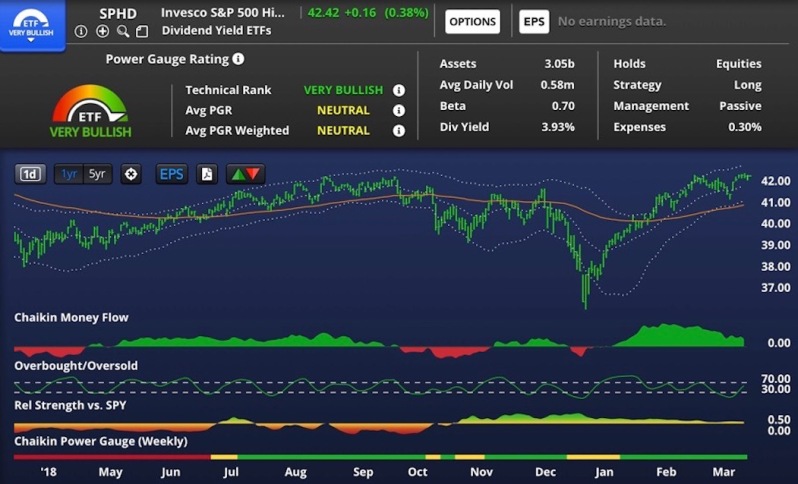
Figure 2 – Invesco S&P 500 High Dividend Low Volatility (SPHD)
Either or both of these ETFs would be good choices for an equity income investors.
The yields (4.28% for SPYD and 3.93% for SPHD) are higher than is the case for the typical ETF of this sort, and the Betas suggest histories of comfortably low relative market risk (0.78 for SPYD and 0.70 for SPHD). Both ETFs are experiencing solidly positive Money Flow (strong “smart money” demand), and bullish chart patterns based on moving average trends.
In a perfect world, we’d also see more bullishness in terms of relative performance (stock personality). What we do see, however, (marginally positive readings) are better than for most of the other favorably rated equity-income ETFs.
If one wants, one can stop right here and call it a day. Many, however, might want to continue on.
Taking It Further – Searching For Stock Ideas
For each of these two ETFs, I loaded their respective constituent lists into the Chaikin Analytics platform and focused on those stocks with (i) bullish overall Power Gauge ratings, (ii) high yields, (iii) generally favorable ratings in for the Sentiment and Technical Power Gauge subcategories (two categories I deem especially useful for tapping into Mr. Market’s views on dividend risk), and (iv) favorable charts as per the preferred method of evaluating Chaikin charts.
Through this process, I identified four ideas, the two domestic tobacco giants, Philip Morris (PM) and Altria (MO), and two utilities, Centerpoint Energy (CNP) and Southern Co. (SO).
Tobacco
Let’s start with the obvious: If social consciousness is part of your investment sensibility, you’ll have to pass on the tobacco stocks. They are both getting into e-cigarettes, supposedly safer ways to consume tobacco. But these remain small portions of the businesses and it’s premature to pronounce the safety aim has having been achieved. Regulators remain skeptical they continue to lean hard on the industry. And tobacco consumption continues to decline. Nevertheless, Philip Morris and Altria both look attractive in the Chaikin framework.
Figure 3 – Philip Morris (PM)
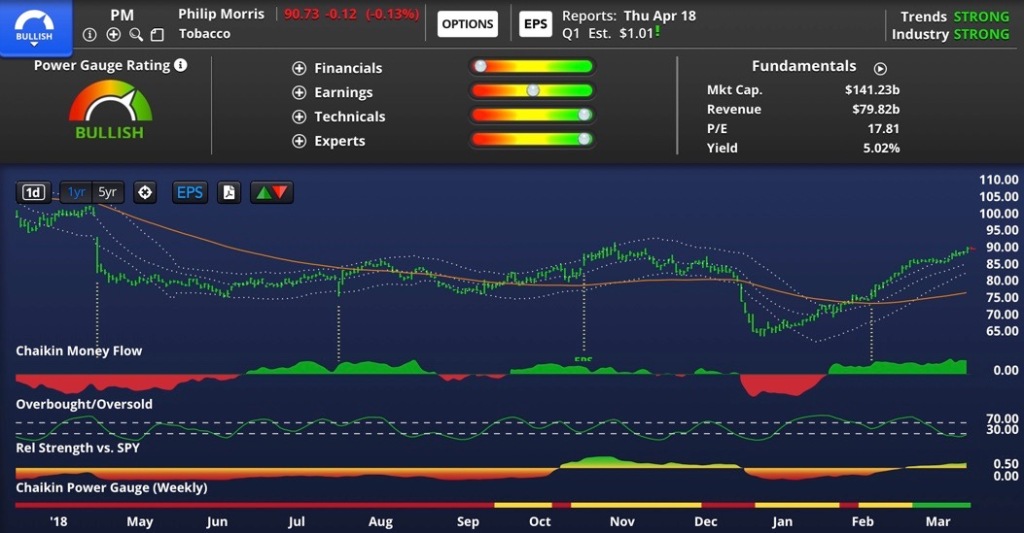
Figure 4 – Altria (MO)

The bad news, as noted, involve health problems, declining consumption, and uncertainty about the futures of the new e-product lines. The “good” news, if you want to call it that, is that these are among the worst-kept secrets in the investment world. There is absolutely nothing negative anyone can say or think about this business that is not already widely known and understood within the investment community.
So rather than dig for negatives (which is usually the prudent approach to stock analysis), we need to dig for the positives. In this day and age, nobody gets brownie points for passing on yields near and above 5% on relatively safe payment streams.
The keys to both stocks are brand power (Marlborough may well be the Coca Cola of the smoking world — Altria distributes it in the U.S.and Philip Morris distributes in the rest of the world) and extreme customer loyalty (aw heck, let’s just grit our teeth and utter the a-word, addiction). As a result, both firms possess incredible pricing power, enough so to keep raising prices by more than enough to offset declining volume.
It may be naive to assume the trends will persist forever so I wouldn’t put these stocks into a trust account opened for a newborn and assume they can be held until money is eventually needed for college, said newborn’s first mortgage or even its eventual circa Y2.1K golden years. (It’s OK to own the stocks in such accounts; just monitor for selling opportunities over time rather than buying and forgetting). But for the time horizons of the typical income seeker, these stocks ought to be fine, again, so long as one doesn’t buy and forget (which one should never do with any stock).
Utilities
Once upon a time, when one wanted equity income, one bought and held electric utility stocks. Early in my career, a senior utility analyst explained to me that if one couldn’t forecast utility earnings and dividends, it meant one didn’t know how to use a ruler and graph paper. I don’t know if that was accurate because my pleas to the research director to get me out of utilities (z-z-z-z-z) were heard.
Just after I escaped the utility doldrums, the area got exciting (or at least things happened beyond the usual capex budgets and rate increase applications). Energy prices went haywire. These supposedly natural monopolies became deregulated (or at least much more loosely regulated), they scrambled to obtain power, they competed with interlopers, and they expanded into other businesses. Some flourished. Other didn’t. Enough pitched themselves to the Street as growth stories that the sector could no longer function as the equity-income no-brainer it had traditionally been.
Of the two selections presented here, Centerpoint, although not completely traditional (it’s diversified in terms of territory and business through stakes in various aspects of the natural gas business) it comes closer to the old mold in that its challenges seem more routine than traumatic. The big thing to look forward to, here, is the accretive impact of a large recently-completed acquisition that adds parts of Ohio and Indiana to the portfolio of electric utility businesses (that are already established in the Houston and Minneapolis areas). Challenges include the impact of commodity prices on the natural gas side of things, and a tough comparison coming up due to declines in transmission right of way revenue at Houston Electric.
With so much of what’s happening at Centerpoint coming under the heading of basic, its yield, 3.73%, is at the low end of my high-yield collection.
Figure 5 – Centerpoint Energy (CNP)

Southern Co. is a different story. The yield, 4.63%, is high and the chart is terrific. It’s a bit overbought right now so a better-timed entry point may be down the road. But don’t expect anything dramatic here; this is a rapidly-fluctuating indicator and even as things stand now, buying at present is hardly the worst sin an equity income investor is likely to commit.
Figure 6 – Southern Co. (SO)
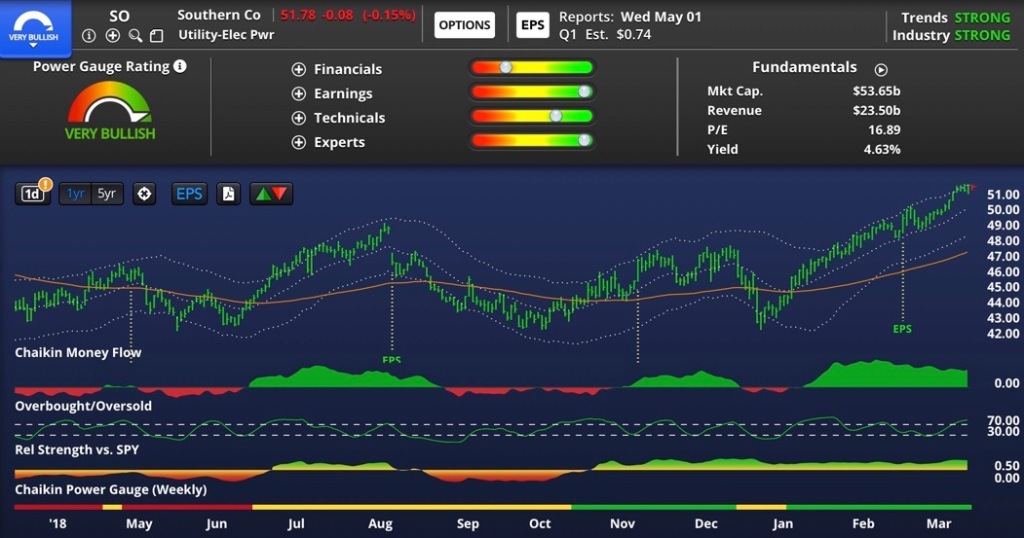
The big story here is execution with respect to new capacity. Much of what you’re likely to read on this company is probably negative. The company is way over budget and behind schedule on some major projects. Bloggers and commentators are all over this. Interestingly, though, the “smart money” doesn’t seem to be as bothered, as exemplified by the very strong rating in terms of the Sentiment component of Power Gauge and the strongly positive money flow readings. The heavy spending has impacted the fundamentals (note the lackluster Financial subcategory ranking). But the Technicals rank is positive.
But it looks like the market, including the pros who look most closely at the details, is coalescing around the view that Southern is over the hump in terms of its projects and that completion is in view. And it’s not as if the projects were a bad idea: Morningstar’s Charles Fishman suggests that coal, which was used to generate 80% of Southerns power in 2000, could see its share drop to below 20% by 2030.
Finally, even those who continue to pile on with the negative stories, are not contemplating dividend cuts. They just question the rate of future dividend growth. With a yield of 4.63%, that’s OK. Southern need not be a growth leader. Dividend growth is a completely separate strategy and those who pursue this need to be prepared nowadays to accept yields below, and at times, well below, 3%. (The mega-sized growth-oriented Vanguard Dividend Appreciation ETF (VIG) yields just 1.86%.)
Conclusion
As seen with the tobacco stocks and Southern, there’s baggage. The combination of Power Gauge, its Technical and Sentiment sub-categories, can b used to put the baggage in context, which is an important thing if one is going to have any hope of finding a decent yield without venturing into the world of speculation.
Disclosure: None.


