
Getting Closer!
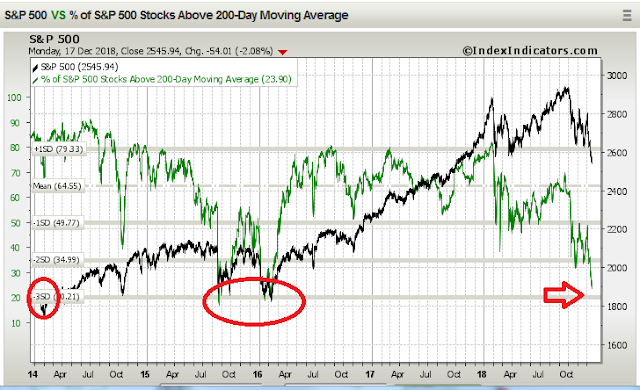
This is a chart of the S&P 500 overlayed with the percentage of stocks above the 200-day moving average. Stocks are quickly getting close to that area (-3 standard deviations or 20% above their 200-day) which helped the bottoming process back in 2016.
Disclosure: None.
How did you like this article? Let us know so we can better customize your reading experience.

Comments
Leave a comment to automatically be entered into
our contest to win a free Echo Show.

