
Geopolitical Risk. Is This The Big One For Investors?
That makes a 3-week winning streak for the major averages. The S&P 500 rose roughly 1% in the past trading week as investors eyed and achieved the all-important 3,000 level. As shown in the chart below, the benchmark index is holding nearly 2% above the 50-DMA, while all moving averages are moving higher in a bullish trend.
All Things S&P 500
(Click on image to enlarge)

Why point out the rising moving averages you might be asking? I have been indicating opportunities to raise cash and look to buy dips. These are typically understood to be active management exercises. While the S&P 500 has broken out of a recent trading range, we can argue that active portfolio management has found rebalancing opportunities ahead of market pullbacks to be an optimal strategy in 2019. Once those pullbacks come to fruition, there has been the guided opportunity to buy the dip and/or deploy capital, for which the market subsequently rose once again. In other words, in 2019, rebalancing and buying dips with cash on-hand has found active management surpassing that of passive management. It's not always this way, but with 2 separate 5% pullback's year-to-date, the active managers with the right market thesis have benefitted from the market gyrations. And with this in mind I revisit my thesis from the trading week, originally offered in last week's Research Report, at finomgroup.com (subscription required) as follows:
"Presently, those market internals/indicators suggest…drumroll… the S&P 500 should trend higher in the coming week. As shown below, the S&P 500 Breadth Momentum Oscillator has turned sharply higher after bouncing off of support for the 2nd time this year alone."

So with yet another weekly gain in the S&P 500 and most every index ETF in overbought territory, how much upside is left? This is recognized as the risk vs. reward consideration. Depending on how much upside can be hypothesized for, the risk/reward calculation can help to determine how we manage our cash and existing investments/trades. Additionally, the technicals are not where we want to extrapolate our answer to the aforementioned question, solely. This question demands a fundamental thesis, with a technical overlay. I'll get to the fundamentals a bit later of course. The technicals remain bullish, but have stalled out at present levels in the past.
(Click on image to enlarge)
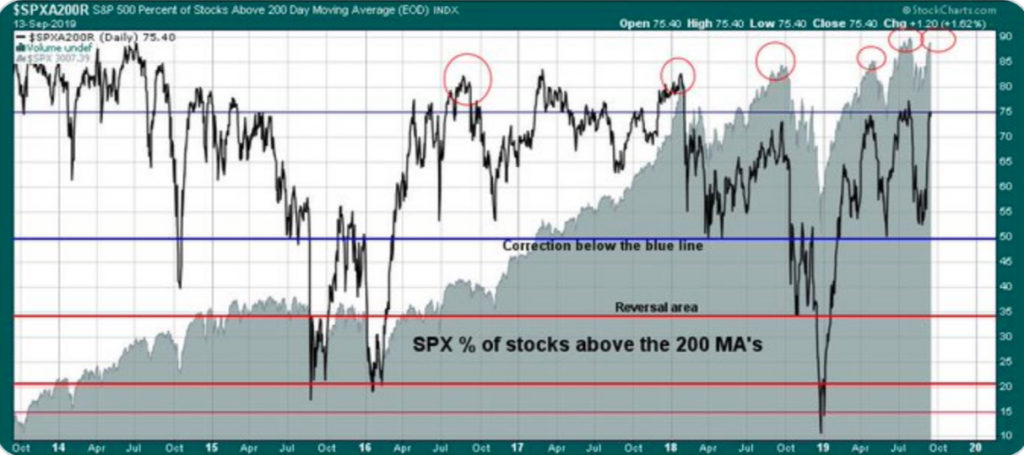
The positioned chart above identifies the number of S&P 500 stocks trading above their 200-DMA. Fortunately, this breadth indicator is a net positive, indicating a healthy and bullish trend has been in place. At present, the percentage of stocks trading above their 200-DMA is roughly 75 percent. Unfortunately, as we can also see in the chart, each of the last 2 times we've hit the 75% level, the market has pulled lower. Does this mean the same breadth level will present another pullback? According to this particular market breadth indicator it says we are in the area where we should start to expect a near-term pullback, but...
(Click on image to enlarge)

The chart above is the S&P 500 Bullish Percentage Index or BPI. The index has been rising over the last 3 weeks, as we would expect with the S&P 500 rising in kind. This particular breadth indicator suggests there's still at least another 8 percentage points to go before a higher probability of a pullback is presented.
Yes, the market should pullback in the near-term, given the overbought conditions, S&P 500 BPI and the percentage of stocks trading above the 200-DMA. When will the market pullback; that's the mystery. Long-term investors bear no need to fret over the near-term market headwinds, which simply question as to when investors will take some profits. But for active portfolio managers, I would suggest the overbought setup going into an FOMC rate announcement week isn't the most favorable setup. Nonetheless, the current breadth and moving average clusters do not suggest investors should hold a bearish sentiment longer-term. (See charts below)
(Click on image to enlarge)
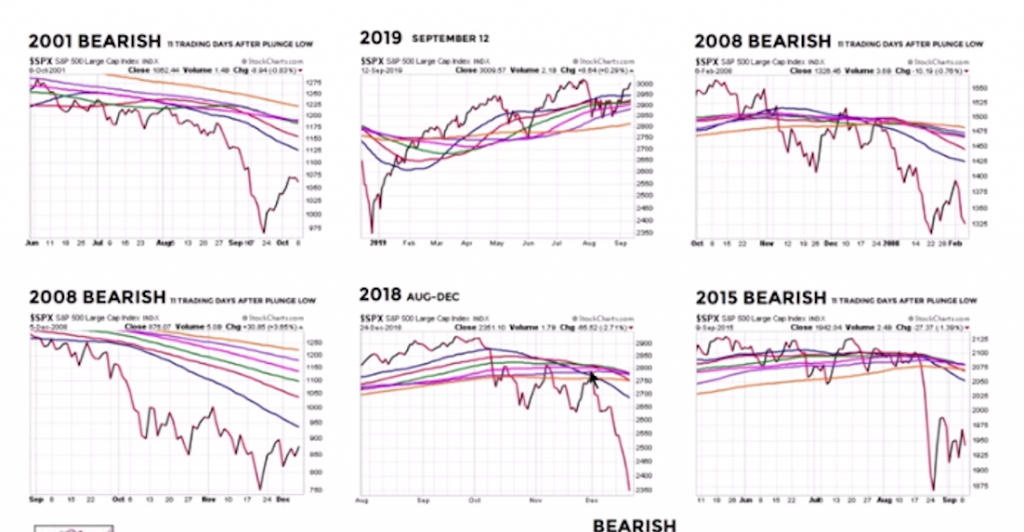
The middle, 2019 S&P 500 chart of moving averages, doesn't look like any of the bearish charts from other years. The S&P 500 is presently above all moving averages and some of the moving averages such as the 50 and 200-DMAs are curling up. You'll also notice the orange line, the 200-DMA is on the bottom in 2019, while it is in the middle or top in the bearish years indicated. Bullish conditions are present, but yes, they can turn and as such we remain actively engaged week-to-week.
More importantly than the question, "When will the market pullback", might be, "What should we do when the market pulls back?" I remain of the opinion that the economic and market fundamentals support a "buy the dip" participation. I recognize both have weakened on a YoY basis, but the causation of the weakness can be remedied and are on such a path presently. Additionally, history suggests that the stated breadth of the market supports the market moving higher over the next 2 years, at least.
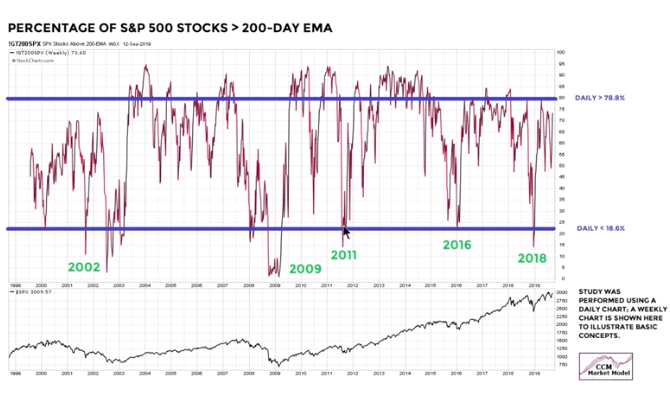
There are few occasions since 2003 whereby only 20% of S&P 500 stocks traded above there 200-DMA and subsequently that number rose to 78 percent. The chart below identifies the occasions for when it did happen.
(Click on image to enlarge)
Given the breadth thrust occurrences in the past, we can determine the probabilities for market returns in the future. The table below addresses the probabilities, which point to above average annual returns over the coming years.
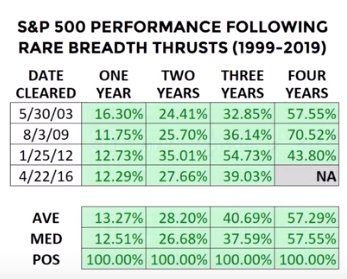
Certainly, history does not always repeat itself, but the probabilities give us an idea of what we can expect and beg of investors to keep an open mind about the probabilities. Given all the technicals and market internals noted, I do not believe the S&P 500 has peaked for the calendar year or the market cycle that turned bullish in 2009. Of course, an exogenous shock to the economy is beyond my reach to forecast, and always poses a tail risk.
With regards to the passive vs. active management commentary previously offered, it is well recognized that passive has beaten active for a good many years. On Thursday, Morningstar released its semiannual analysis of active funds compared to passively-managed peers.
Only 23% of all active funds topped the average of their passive rivals over the 10-year period ended June 2019. What’s more, the cheapest funds succeeded more than twice as often as the priciest ones (33% success rate versus 14% success rate) over those 10 years.
“The big picture takeaway is that active management is a really difficult game and finding good active managers is more difficult still,” said Ben Johnson, Morningstar’s global director of passive strategies research."
Morningstar defines “success” in two ways. First, a fund must survive over the period in question. During the ten years ending in June 2019, 61% of active funds, and 78% of passive funds, survived. The fund must also generate a return that’s greater than that of the average of equivalent passively-managed funds, not just compared to a single benchmark index.
Over the past 10 years, only 8% of active U.S. large blend funds outperformed the average passive equivalent, while 82.4% of foreign small-mid blend, and 61.5% of corporate bond funds did. But in the last 12 months something changed... During this period, active funds overall have done better. Nearly half (48%) of active U.S. stock funds survived and outperformed their average passive peer over the 12 months through June 2019, up from 37% in the year ending June 2018.
I've always believed in a mix of active and passive market participation. Diversity in one's portfolio does not suggest anything less than diversity in one's participation. Having said that there does remain one truism about equity markets: Equity markets ascend over time. Markets can express severe drawdowns intermittently, but over time they only move higher. This, in part, has given rise to the focus of passive participation, which otherwise induces liquidity risks to the market that had not been a characteristic of the market in past decades. So, maybe two truisms: Markets rise over time and evolve.
So with a steady march higher in the S&P 500, and as investors grapple with a sector rotation phenomenon, the S&P 500 14-Day RSI has also moved higher.
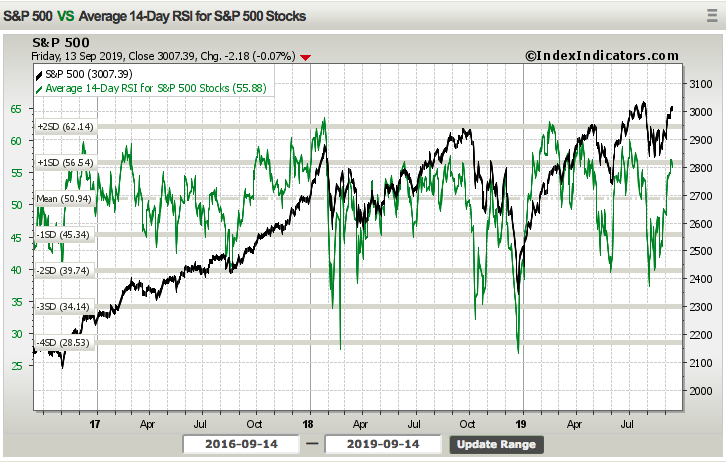
Like other market internal metrics/breadth, the 14-Day RSI also suggests the market has a bit more room to run higher. Always keep in mind though, Presidential tweets don't consider all the aforementioned bullish breadth and technical indicators. Geopolitical flare ups of consequence tend to lack consideration as well.
For the past trading week, once again the S&P 500 maintained within the weekly expected move of $38/points. In fact, it hit it on the head Thursday, before pulling back.
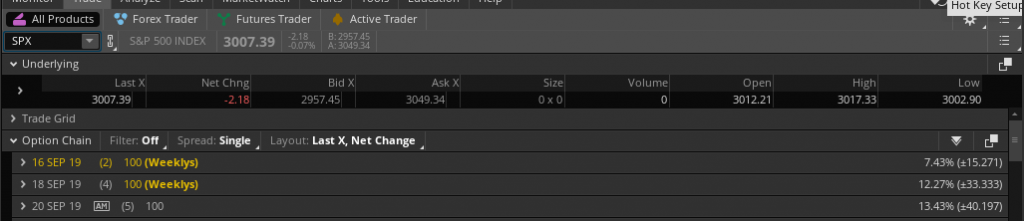
For the coming week, despite the VIX falling another 8.4% for the week, the weekly expected move has risen slightly to $40/points.
Macro-Economic Data & Geopolitical Backdrop
Heading into the coming trading week, although the temperature of the U.S./China trade war has been lowered and found both parties issuing a more congenial and amicable tone, a middle east flare up has presented itself.

Saudi Arabia is shutting down half of its oil production after drones attacked the world’s largest oil processing facility in the kingdom, The Wall Street Journal reported. The closure will impact almost five million barrels of crude production a day, about 5% of the world’s daily oil production, the WSJ reported, citing sources familiar with the matter.
Early Saturday, an oilfield operated by Saudi Aramco, the state-owned oil giant, was attacked by a number of drones, which sparked a huge fire at a processor crucial to global energy supplies. Yemen’s Houthi rebels have claimed responsibility for the attack, saying it was one of their largest attacks ever inside the kingdom, the WSJ reported.
“We promise the Saudi regime that our future operations will expand and be more painful as long as its aggression and siege continue,” a Houthi spokesman said. The attack deployed 10 drones, the Houthis said.
The Saudi interior ministry said the fires were under control, according to state-run Saudi Press Agency, adding the investigations into the terrorist attack are ongoing.
Secretary of State Mike Pompeo said Saturday that Iran is responsible for the drone attacks on important facilities in Saudi Arabia’s oil-rich Eastern Province that reportedly forced the kingdom to shut down half of its oil production on Saturday.
“We call on all nations to publicly and unequivocally condemn Iran’s attacks. The United States will work with our partners and allies to ensure that energy markets remain well supplied and Iran is held accountable for its aggression.”
With this event taking place over the weekend and with markets closed, analysts are already speculating on what the attacks will do to the price of crude come Sunday evening futures market opening. Oil analysts and traders told CNBC the impact on the commodity’s price could be double digit.

“This is a big deal,” said Andrew Lipow, president of Lipow Oil Associates. “Fearing the worst, I expect that the market will open up $5 to $10 per barrel on Sunday evening. This is 12 to 25 cents per gallon for gasoline.”
Kevin Book, head of research at Clearview Energy, said the price impact will depend on the repair time which can take weeks to months.
“Our baseline assumptions, which incorporate public assessments of strategic petroleum reserve capacity and OPEC spare capacity, imply a net shortfall of ~1 MM bbl/d, or at least a ~$6/bbl premium to the ~$60 Brent close,” Book said in a note. “Exclusive of this supply offset, and assuming a three-week shutdown, our models imply ~$10/bbl of upside.”
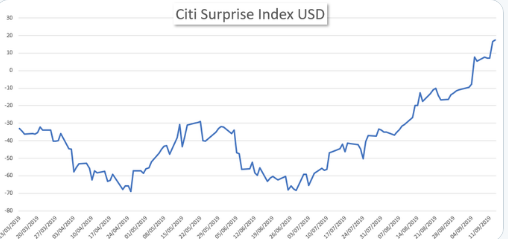
With the latest geopolitical warfare issue of the week now presented for its carried risk, we move on to take a look at the latest economic data. By and large, the economic data has proven above economists' expectations over the last few weeks and shy of the Nonfarm Payroll headline number. The Citi Economic Surprise Index rose above 17 this past week on the heels of a very strong August retail sales report.
While the NFIB small business index dipped from 104.7 to 103.1 during the month of August, the number of Job openings remained quite strong in the U.S. economy. Layoffs remained extremely low and the number of people quitting hit an all-time high, typically a mark of a strong jobs market. The number of open jobs slipped to 7.22 million in July from 7.25 million in the prior month, the government said Tuesday.

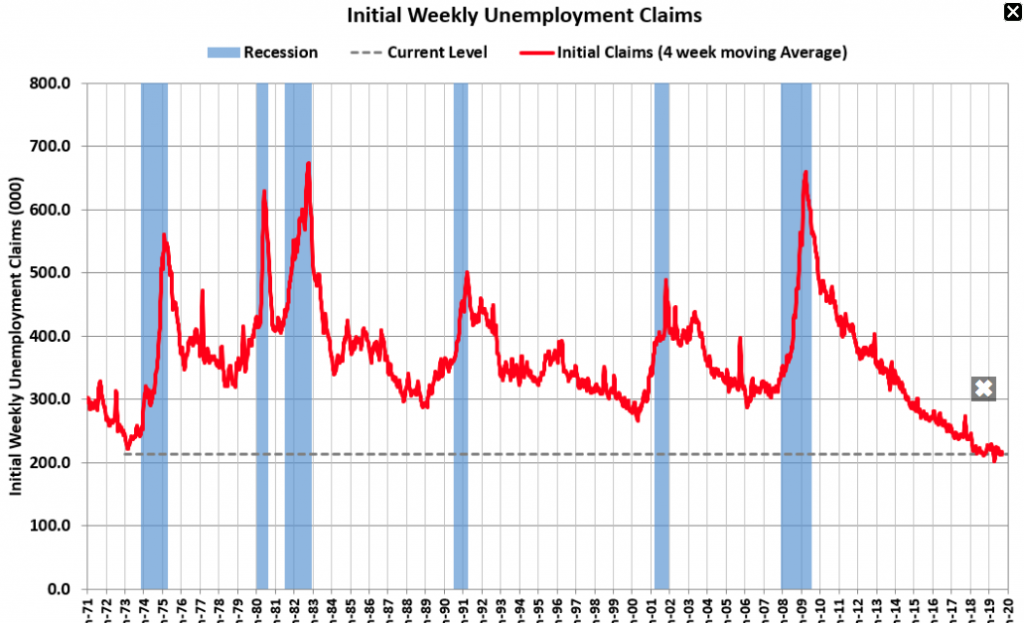
Any JOLTS survey headline number at or above 7mm is a sign of a robust labor market. A strong labor market was mirrored in the weekly Initial Jobless Claims release on Thursday this past week. Initial jobless claims, a rough way to measure layoffs, dropped 15,000 to 204,000 in the seven days ended Sept. 7, the government said Thursday. The 4-week moving average was 212,500, a decrease of 4,250 from the previous week's revised average.
Probably the most concerning or anticipated data for the past week came from the consumer sector and by way of monthly retail sales and the University of Michigan's Consumer sentiment reading. Retail sales rose 0.4% last month, the government said Friday, but sales were flat excluding new cars and trucks. Economists were forecasting a rise of just .2% for the month of August, highlighting the pull-forward affects from Amazon Prime and competing sales during the month of July. This coupled with a 25 cent YoY shortfall in gasoline prices had many analysts believing a decline of retail sales was more probable.
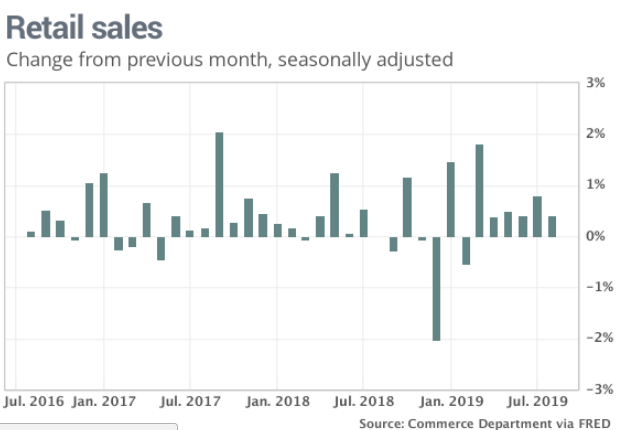
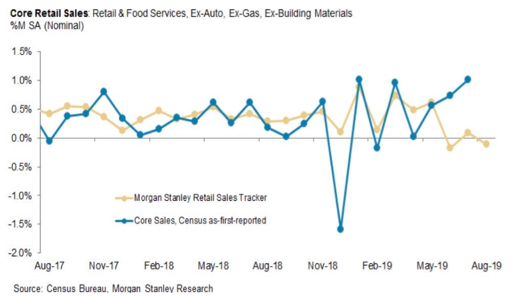
Recall from one of my articles this past week the following notes from Morgan Stanley, who was warning clients of a potential drop in retail sales:
"Reverting back to our considerations for Friday’s monthly retail sales data, Morgan Stanley is of the opinion that a disappointment is in store for investors. Coming off a rather strong July retail sales print, the firm believes some one-off issues were pulled forward from August, namely Amazon Prime Day, and that will play poorly in the upcoming retail sales report."
This is turning out to be a really bad year for Morgan Stanley analysts, who are already doubting their own bearishness, given the recent rebound in the equity market and resilience of the U.S. consumer. Cross asset strategist Andrew Sheets says the global economy may be poised for an upside surprise and investors aren’t ready for it. In a note to clients that published last weekend, Sheets explores the possibility that his bank’s “below-consensus” view on global growth could be wrong, and better days may be ahead if trade tensions thaw further, China offers more stimulus and global manufacturing woes start to bottom out.
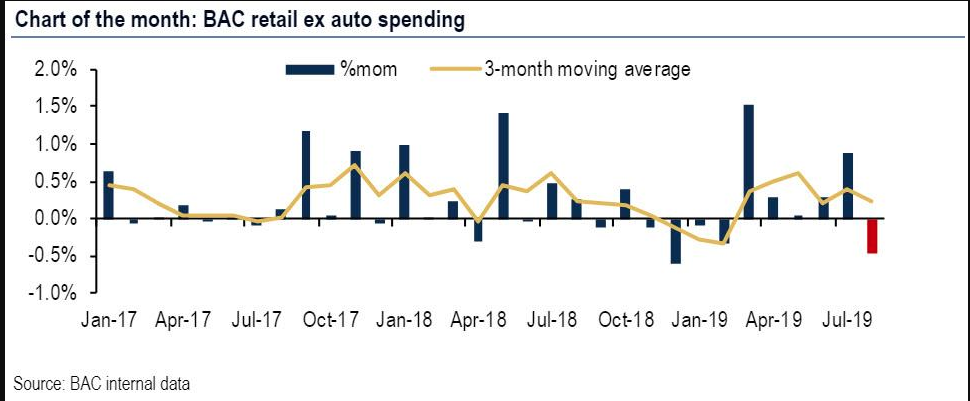
Morgan Stanley wasn't alone in believing retail sales would falter in August. Specifically, BofAML said that they found that retail sales ex-autos fell 0.5% month-over-month, which reversed the 0.9% gain in July, and was not only the first monthly contraction since February this year, but was also the biggest monthly drop in 2019.
- Based on the aggregated BAC credit and debit card data, retail sales ex-autos fell 0.5% month-over-month (mom) seasonally adjusted (sa). This reversed the 0.9% mom gain in July. As always, there were a number of “special factors” which we decipher in this note.
- Amazon Prime Day and other retailers’ summer promotions in mid-July provided a significant boost to spending, as we showed last month. In our view, these promotions effectively pulled forward demand into July and out of August.
- Outside of the promotion distortions, we also think spending was dampened by weakening sentiment.
When I looked into these analysts' notes and findings, Finom Group recognized that they were absent consideration of how strong August auto sales were. Auto sales grew .7% MoM and YoY in August and proved to be the driving force for the monthly retail sales. If we were to strip negative gasoline impact and the strong auto sales out, August retail sales would have been higher by roughly .5 percent. Additionally, the prior two monthly retail sales reports were revised higher. It was a damaging report for the recessionary fear mongers and bears. And to make matters worse, the University of Michigan Consumer Sentiment index rose more than expected.

The September print on consumer sentiment rose to 92 from 89.8 in August, the university’s Surveys of Consumers data showed. Economists polled by Dow Jones expected sentiment to rise to 91. The current economic conditions index also rose to 106.9 from 105.3.
The coming week will be filled with anxieties over the FOMC meeting and rate announcement for sure. And now we are forced to contend with a Middle East flare up. We anticipate market participant hedging activity to persist in the coming week, especially on Monday, which is typical. Friday's action in VIX options (VVIX chart below) helped us to understand recognize the fear surrounding the upcoming Fed meeting.
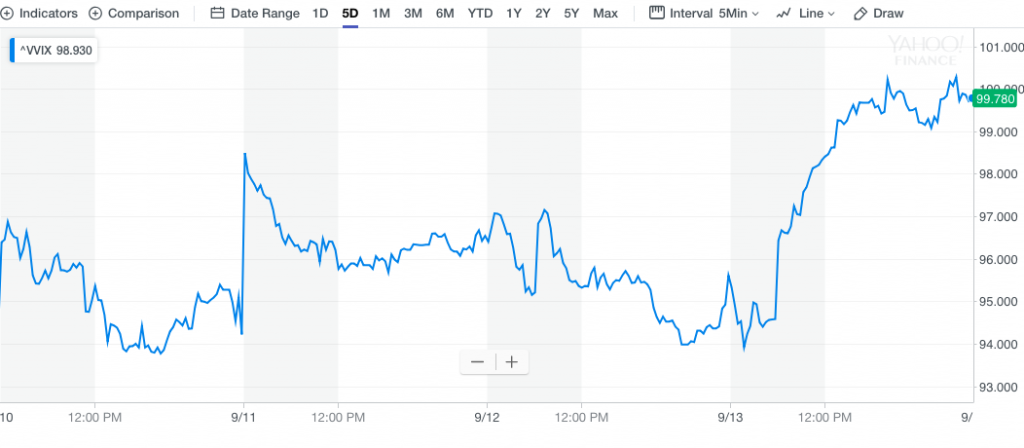
It's not so much about the rate cut, which is a given at 25 bps, but rather about chairman Jerome Powell's press conference and forward looking statements. It's no secret that the Fed chairman has an infamous track record with regards to the stock market's performance on Fed days under his leadership. The market has only been higher 2 times out of 12 with Powell at the helm.
Two members opposed the last rate cut, and even more could oppose this one come Wednesday, which might cause investors to reconsider their beliefs about future rate cuts. Some strategists have said the more dissents, the more it would add to increased market volatility, since the Fed outlook becomes much more uncertain if Fed officials are not more uniformly supporting policy actions.
Based on economists' projections for rate cuts, they expect at least one more cut in 2019.
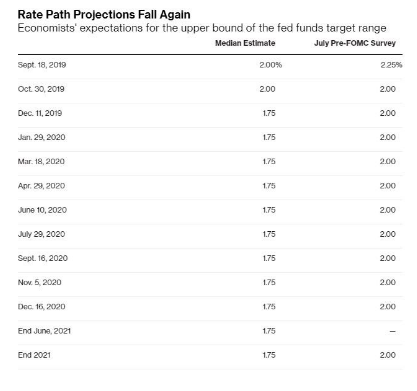
With the markets going into the Fed meeting near all-time highs again, the Fed stands to disappoint markets if it does not explicitly promise more easing. The Fed could do that in the quarterly projection of interest rate forecasts, which will be issued with its economic projections after the meeting. Fed officials include forecasts for growth and inflation, besides interest rates, which appear in a chart known as the “dot plot.”.
“The question is will the Fed signal a willingness to keep going with rate cuts, or will they suggest this mid-cycle adjustment is nearing its end. My view is they’re not going to back themselves into a corner, and they’re going to give themselves plenty of room to cut again at some point,” Michael Arone, chief investment strategist at State Street Global Advisors.
“That’s going to be the biggest risk right now. The markets are pricing in a number of rate cuts in the next few quarters and will the Fed deliver on that...That will be a friction point.”
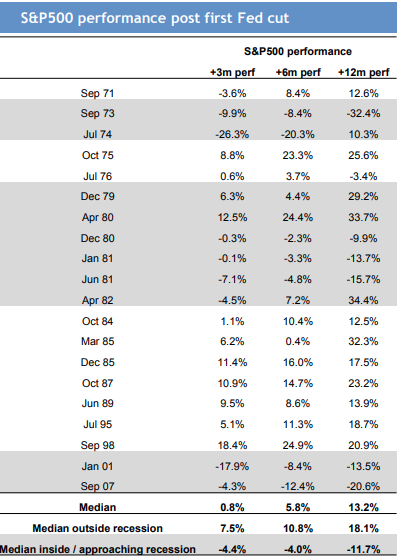
Regardless of how the market reacts and especially if Powell's trend holds true once again, I'm forced to recognize a key fact that determines the future path of the market when the Fed eases financial conditions and the economy is not in a recession; markets go higher. (See table below from GS)
Aside from the FOMC-show of force this coming week, here is the scheduled economic data points set to be released, as offered in the following MarketWatch table:

Investors likely anticipate the regional manufacturing indexes and housing data to be among the most heavily anticipated reports for the week ahead.
Fund Flows
According to Lipper Weekly FundFlow Insights data, ETFs (+$17.5 billion) took in net new money for the fourth week in five, paced by equity ETFs (+$13.4 billion). Among this asset group, the largest individual net inflows belonged to SPDR S&P 500 ETF (SPY, +$7.7 billion) and iShares Russell 2000 ETF (IWM, +$3.0 billion). Taxable bond ETFs (+$4.1 billion) also put up a significant positive net flow number, while muni bond ETFs contributed $51 million to the total. The largest individual net inflows for taxable bond ETFs were attributable to iShares Floating Rate Bond ETF (FLOT, +$673 million) and SPDR Bloomberg Barclays High Yield Bond ETF (JNK, +$587 million).
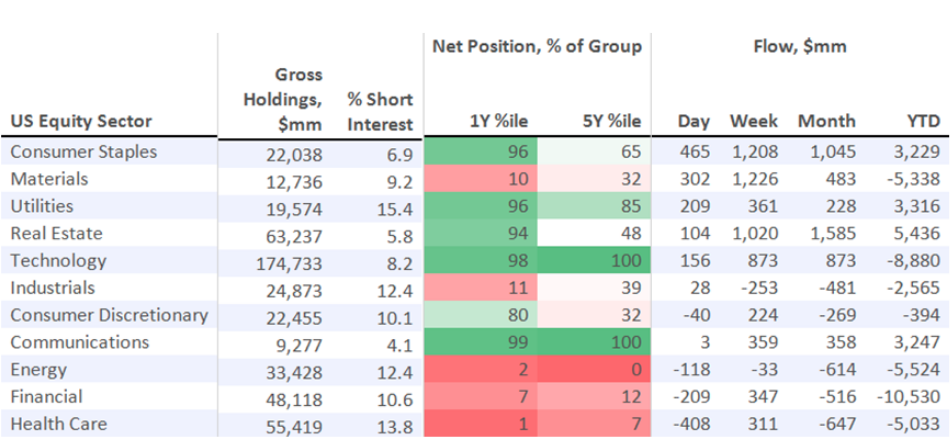
In terms of where are investors positioned and fund flows over the last day, week, month and YTD, here is a chart from Morgan Stanley, which identifies positioning by sector:
Unfortunately, that might be where the good news ends with regards to our weekly fund flows research and insights. While corporate buybacks remain the strongest bidder of U.S. equities to-date, insiders are selling. According to research firm TrimTabs, in the month of August insiders at American companies were selling, on average, about $600 million worth of shares in their own companies a day (all figures US).
Five times this year already they've sold more than $10 billion worth of stock in a single month. The last time the markets saw that much selling that many times in a year was in 2006 and then again in 2007 — right before the stock market imploded in late 2008.

Insiders at technology companies, including the so-called FAANG stocks have been some of the biggest sellers. That could be a sign they think the impressive years-long run-up in the share prices of those companies is over.
Data from Canadian investment firm INK Research shows that Amazon insiders have sold $2,862,703,598 worth of shares in the company through July and August — three times the amount of any other company.
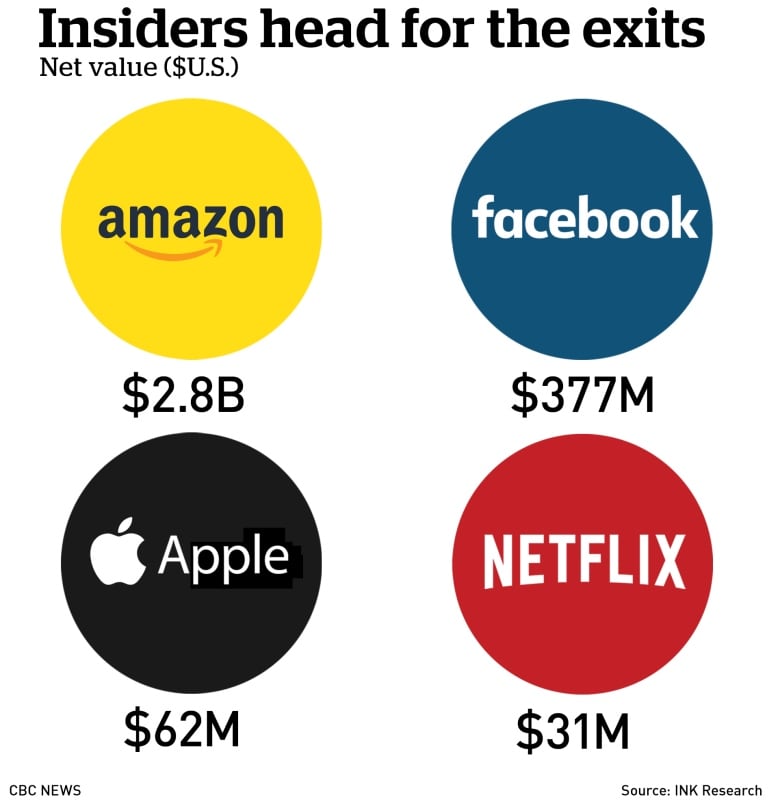
Four high-flying tech stocks have seen major insider selling in the past two months. (Joan Dymianiw/CBC)
A good chunk of that was by founder Jeff Bezos, who was possibly selling shares to abide by the terms of his divorce agreement with wife MacKenzie, from whom he split earlier this year. But other Amazon insiders have also been selling. And while the company may comfortably sit atop the insider selling leaderboard, other tech companies are on the podium.
Facebook insiders have sold a net of $377,471,675 worth of their company's stock; Apple insiders $61,942,104; and Netflix insiders $31,264,279, all since Canada Day.
Earnings Outlook
Earnings are still expected to grow in the low single digit range for 2019, but in order for the S&P 500 to continue to trek higher, multiple expansion will need to take place. With this in mind, we can't help but to recognize that earnings season will commence in mid-October and the current forward four-quarter (19Q3 –20Q2) P/E ratio for the S&P 500 is 17.6. That's getting rich already, but with rates being what they are, we would have to suggest the richness remains relative.
Throughout 2019, each quarter has be met with an earnings recession forecast. The Q3 period is no different. But for the Q2 period that is coming to an end, here is what Refinitiv has tracked in the way of earnings and revenues:
Aggregate Estimates and Revisions
- Second quarter earnings are expected to increase 3.2% from 18Q2. Excluding the energy sector, the earnings growth estimate is 3.9%.
- Of the 499 companies in the S&P 500 that have reported earnings to date for 19Q2, 73.9% have reported earnings above analyst expectations. This compares to a long-term average of 65% and prior four quarter average of 76%.
- 19Q2 revenue is expected to increase 4.6% from 18Q2. Excluding the energy sector, the growth estimate is 5.1%.
The estimated earnings growth rate for the S&P 500 for 19Q3 is -2.2 percent. If the energy sector is excluded, the growth rate improves to -0.4%. The S&P 500 expects to see share-weighted earnings of $341.4B in 19Q3, compared to share-weighted earnings of $349.1B (based on the year-ago earnings of the current 505 constituents) in 18Q3.

From our standpoint, the 2019 Q3 earnings season got underway when Oracle (ORCL) released its August quarter results a day ahead of schedule on September 11. There are an additional four S&P 500 members slated to report results this week. These include FedEx (FDX) and Adobe Systems (ADBE) on Tuesday, General Mills (GIS) on Wednesday and Darden Restaurants (DRI) on Thursday.
All of these companies have fiscal quarters ending in August, which we count as part of our September quarter tally. The fact is that by the time JPMorgan (JPM) reports September-quarter results on October 15, we will have seen such Q3 results from almost two dozen S&P 500 members.
While there is yet to be delivered an updated Q3 Earnings outlook from FactSet (-3.6% YoY), we do have an updated Q3 Earnings outlook from Zach's Research. For the September quarter, the expectation is that earnings for the S&P 500 index will decline by -4.8% from the same period last year on +4.2% higher revenues, with 12 of the 16 Zacks sectors expected to have lower earnings compared to the year-earlier period, including the Tech sector.

"The overall tone and substance of management guidance during the last earnings season was on the negative side. This reflected a combination of slowing economic growth, particularly beyond the U.S., and rising input expenses. As a result, analysts steadily lowered their estimates for 2019 Q3, as you can see in the chart below."
The lowered expectations that have taken place in each previous quarter with respect to 2019 EPS forecasts may once again be met with an abundance of quarterly beats. However, we may also be forced to recognize the beats may be less than in the Q1-Q2 period, given the dollar had strengthened further in Q3 2019. Additionally, the price of crude has held below $60 for much of the Q3 period, which will weigh on the energy sector earnings results.
Investor Takeaways & Thinking Long-Term
There is a good deal of geopolitical issues that have plagued investors, economists, strategists and analysts all year long. We don't expect this to all of a sudden become resolved by year's end, although sentiment can and is improving despite the Saudi Arabian oil field attacks this weekend. With all of the uncertainty floating around, if you are confused, you are not alone.
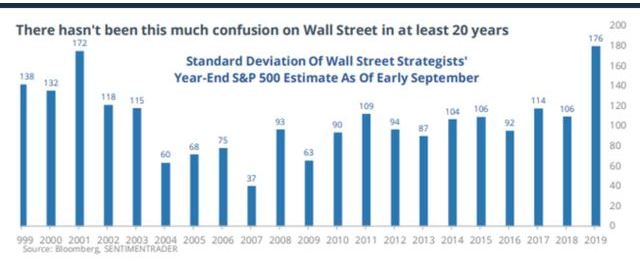
As the graphic above illustrates, the “experts” are sitting right next to you, and they too have no idea of what to make of the investment scene.
Situations with so many variables and unknowns have rarely been seen anywhere else in time. Surprises tend to be the norm not the exception. Yet, market participants are asked to make important decisions while managing their finances, based on these circumstances. The usual result is confusion.
No one really knows if the entire market has peaked or is ready to roll over. Nobody really knows for sure when the next correction will be, how long it may last and how deep it will dive. It's no different with rallies; how high and when is that high too much. All we have to go on is history and probabilities. Then, there are questions about the economy. Where are we in the cycle? What will it look like 6-9 months, or 2 years down the road? Add on the uncertainty of inflation, interest rates, etc., and it makes any person wonder how in the world can they cope and make any sense out of all these unknowns.
In order to help one understand that concept, and how stock market “works”, simply look at where the S&P sits today, and remember ALL of the angst over the trade tariff situation that began in January 2018.
Earlier in this report, I mentioned the aspect of ongoing sector rotation that served to the benefit of the markets on the whole. In the week ahead, we think a combination of geopolitical and central bank risks will subvert this market anomaly of sorts. Keep in mind that the sector rotation has also been characterized by a move away from momentum stocks and into value. Recent notes from Morgan Stanley suggest this flight from momentum stocks should be about to end also.
Morgan Stanley: More on MoMO sell-offs and subsequent equity performance.
- As of yesterday’s close, Momentum has posted a -15.9% move lower from its last peak on September 3 (five trading sessions have passed since).
- Since 1999, there have been 11 instances where Momentum has moved lower by 15% or more in consecutive trading sessions.
- On average, the peak-to-trough move took seven trading days = while equity markets could still be in the early days of this rotation by historical measures, SPX has historically rallied in the one month following these more extreme drawdowns in Momentum (+2.4% on average across these 11 instances, compared to the average monthly return of 42bps going back to January 1999).
Based on Morgan Stanley's statistical data, these rotations out of momentum should end soon and bode well for S&P 500 returns down the road. But... there's always a but isn't there? J.P. Morgan's Nikolaos Panigirtzoglou wrote in a note Sept. 13 note that there may still be more Short Momentum trading to come.
“We see more room from a technical point of view for the gap between Short Momentum and Long Value equity baskets to close assuming the fundamental triggers of this rotation continue to be in place.
Equity long/short hedge funds fell just slightly in August and appear to be “practically unaffected” this month by the large sector and style rotations, while equity market-neutral funds that report daily were little changed on the week."
Panigirtzoglou also offered some observations on equity market positioning, including:
- Not all of the outperforming sectors have been driven by short covering -- for instance, financials may have benefited from new buying
- Most sectors have seen some short-covering this month, suggesting that overall equity positioning is significantly less bearish, or more bullish
- Across long/short equity style baskets, the biggest gap was between the short interest of short momentum and long momentum equity baskets; that difference remains wide even after this week’s covering
In addition to the rotation out of momentum, I've been of the opinion that the small caps underperformance for much of the summer would come to an end. The bearish argument has been that small-caps are underperforming the large-cap stocks and therefore, the divergence is a warning signal that the market is about to breakdown. We've never bought into this thesis. Instead, we believed that at some point, rates would tilt too low and rebound, stimulating a rotation into small caps/Russell 2000, which is heavily weighted by financials that depend on net interest rate margin profits. In other words, instead of the small caps warning that the large caps would fall; we believed at some point small caps would start playing catch-up! And they have for the last 7 trading sessions.

In the past trading week alone, the Russell was up nearly 5% while the S&P 500 was only up 1 percent. Hence, catch-up! Here are small-caps relative to large-caps (IWM/SPY). If we are going to start to see outperformance from the little guys, this would certainly be a logical place for it to start. In the chart below, notice when this ratio bottomed in early 2016; it was when stocks, in general, started to rally hard, following the correction of 2014-2015.

Over the weekend, the markets are going to likely respond negatively to the drone bombings in Saudi Arabia, which has forced the kingdom to shut down some 50% of its output. The attack is the biggest on Saudi Arabia’s oil infrastructure since Iraq’s Saddam Hussein fired Scud missiles into the kingdom during the first Gulf War. The damage highlights the vulnerability of the Saudi industry that supplies 10% of the world’s crude oil. The kingdom’s benchmark stock index tumbled as much as 3.1% on Sunday in Riyadh.
The U.S. Department of Energy said it’s prepared to dip into the Strategic Petroleum Oil Reserves if necessary to offset any market disruption.
“Work is underway to restore production and a progress update will be provided in around 48 hours,” said Amin Nasser, Aramco’s president and chief executive officer. Aramco is working to compensate clients for some of the shortfall from its reserves.
Coming into the trading week, short interest is basically neutral. I anticipate a rally in the energy sector come Monday, and as the markets price in a fearful forecast of crude oil supplies and the media sensationalizes the impact from higher gasoline prices on the consumer.

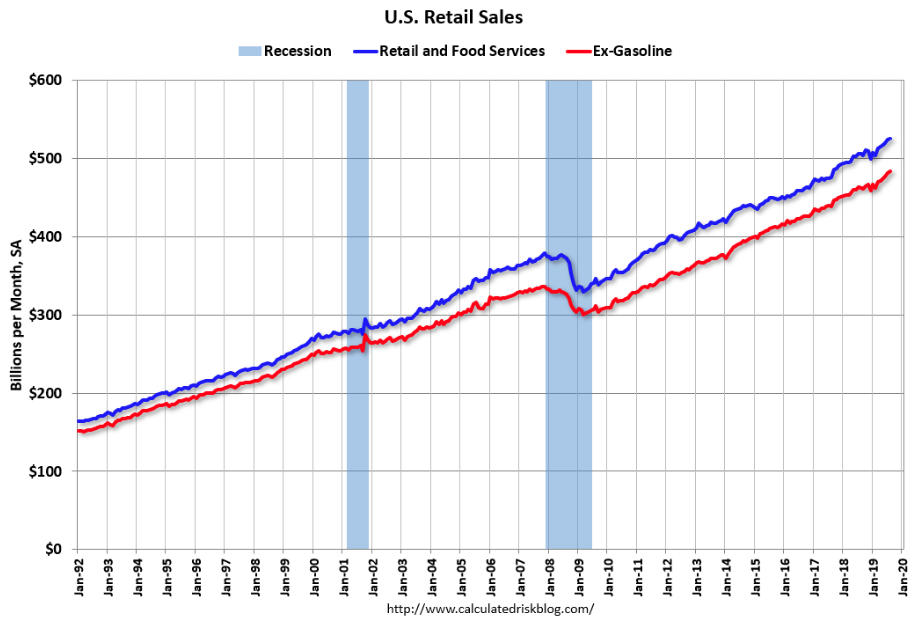
Keep in mind, gasoline prices will also go into the trading week near their lowest levels of the year. Additionally, the chart below identifies just how inconsequential the always fluctuating price of crude oil and gasoline have been on retail sales over time.
Economic growth remains steady in 2019, although slowing on a YoY basis. Finom Group is currently modeling Q3 GDP of 1.8-2%, which is in the range of most economists presently. Here are a few institutional GDP forecast updates for the Q3 Period.
- From Merrill Lynch: 3Q and 2Q GDP tracking remain at 2.0% qoq saar. [Sept 13 estimate]
emphasis added - From Goldman Sachs: Following this morning’s data, we boosted our Q3 GDP tracking estimate by one-tenth to +2.0% (qoq ar). [Sept 13 estimate]
- From the NY Fed Nowcasting Report The New York Fed Staff Nowcast stands at 1.6% for 2019:Q3 and 1.1% for 2019:Q4. [Sept 13 estimate].
- From the Atlanta Fed: GDPNow: The GDPNow model estimate for real GDP growth (seasonally adjusted annual rate) in the third quarter of 2019 is 1.8 percent on September 13, down from 1.9 percent on September 11. [Sept 13 estimate.
This week may prove a hiccup week on the way towards greater market returns. Due to the exogenous event in Saudi Arabia, I hesitate to offer a more substantial forecast or expectations for the week. What we do know is that rates, despite rebounding in the past week, remain low and may have hit a temporary ceiling of sorts. Beyond that, trade with high probabilities and using defined disciplines.


