GBP/USD Price Remains Neutral At1.3850 Under Key MAs
Yesterday’s strong data on inflation in the US-led to a sharp drop in the GBP/USD price. However, sellers did not manage to seriously affect the technical picture of the GBP/USD pair. The bulls actively defended the support and 1.3806 and continue to do so.
British Pound undergoes a fairly abundant selling for the second day in a row during the European session, but it quickly recovers. Unfortunately, the published report of the Bank of England on financial stability did nothing to help the Pound because the bulls did not even manage to protect the support at 1.3874.

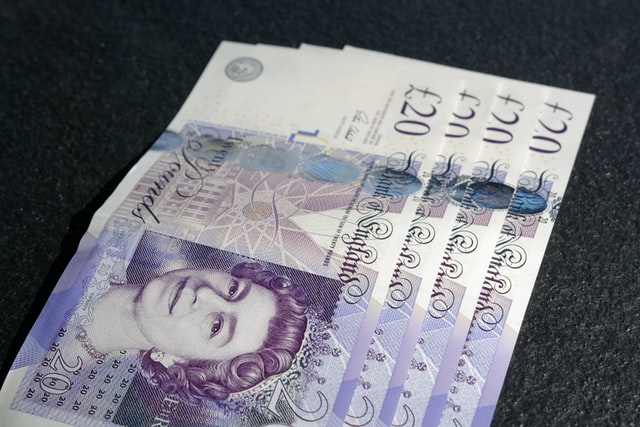
Photo by Colin Watts on Unsplash
The GBP/USD continued to trade as needed on Tuesday. Although after the publication of the report on the US inflation, the pair fell down by almost 100 pips.
At the moment, the economies of Great Britain and the United States are just beginning to recover from the crisis. The American economy does it very quickly, but it is more artificial in nature. On the other hand, Britain is recovering slowly, as evidenced, in particular, by the latest GDP report for May, which turned out to be two times lower than forecasted.
GBP/USD technical forecast: Neutral under key MAs
From a technical point of view, the fall in prices may continue to the area of 1.3600 – 1.3666, and it is best to work out all movements in the pair on the lower timeframes. Sharp reversals are now being observed for the pair, so it is very difficult to react to them on higher timeframes. At the same time, from a fundamental point of view, the pair can resume an uptrend at any time, as the US economy continues to fill with trillions of dollars from the Fed and the government. Thus, we expect the uptrend to resume either from the current positions or after falling to the 1.3600 – 1.3666 area.
The widespread down bar closed below the 20 and 50 SMAs on the 4-hour chart right after the US CPI. Right now, the price is attempting to rise from the 1.3800 crucial level. But the immediate hurdle for the buyers lies at the congestion of 20 and 50 SMA around 1.3835-50. Thus, the level now serves as a pivot point for the directional bias.
(Click on image to enlarge)

GBP/USD price on 4-hour chart
Support levels:
- S1 – 1.3824
- S2 – 1.3794
- S3 – 1.3763
Resistance levels:
- R1 – 1.3855
- R2 – 1.3885
- R3 – 1.3916
Disclaimer: Foreign exchange (Forex) trading carries a high level of risk and may not be suitable for all investors. The risk grows as the leverage is higher. Investment objectives, risk ...
more


