
The GBP/USD pair extends its sideways consolidative price move at the start of a new week and oscillates in a narrow trading band around mid-1.3000s through the first half of the European session. Meanwhile, spot prices remain close to a one-month low and seem vulnerable to prolonging the recent retracement slide from the 1.3535 area, or the highest level since March 2022 touched last month.
The British Pound (GBP) continues with its relative underperformance amid speculations that the Bank of England (BoE) might be heading towards speeding up its rate-cutting cycle. In contrast, the markets have fully priced out the possibility of another oversized interest rate cut by the Federal Reserve (Fed), which assists the US Dollar (USD) to stand tall near a two-month peak and acts as a headwind for the GBP/USD pair.
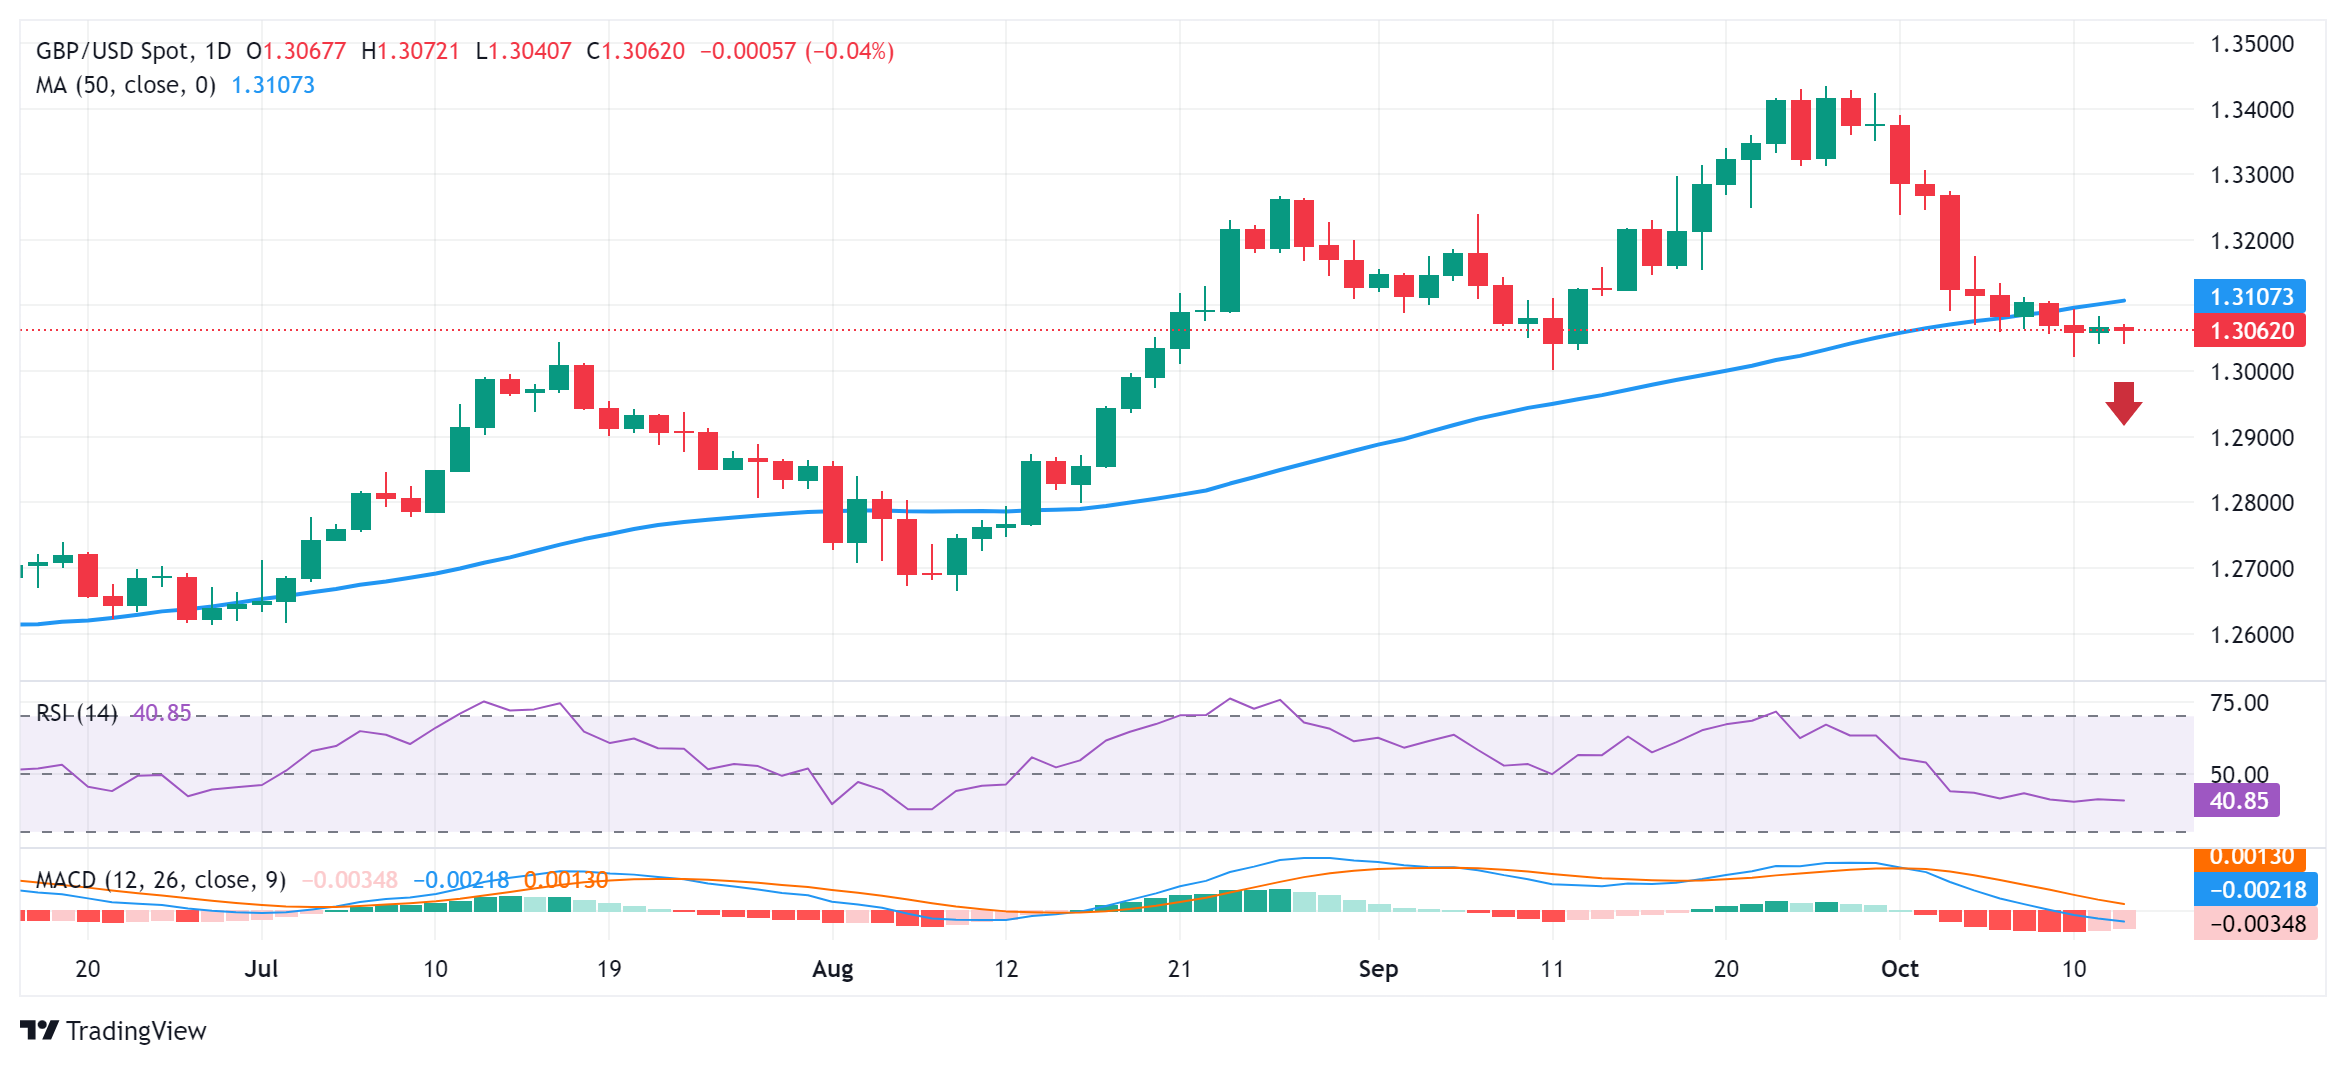
From a technical perspective, last week's close below the 50-day Simple Moving Average (SMA) – for the first time since August 12 – was seen as a fresh trigger for bearish traders. Moreover, oscillators on the daily chart are holding deep in negative territory and are still away from being in the oversold zone. This validates the near-term negative outlook and suggests that the path of least resistance for the GBP/USD pair is to the downside.
Some follow-through selling below the 1.3000 psychological mark, or the September monthly swing low, will reaffirm the bearish bias and expose the 100-day SMA, currently pegged near the 1.2945 region. A convincing break below the latter has the potential to drag the GBP/USD pair further towards the 1.2900 round-figure mark en route to the next relevant support near the 1.2860 horizontal zone and the 1.2825-1.2820 support zone.
On the flip side, the 50-day SMA support breakpoint, around the 1.3100 mark, now seems to cap any attempted recovery move, above which a fresh bout of a short-covering should pave the way for additional gains. The GBP/USD pair might then surpass an intermediate hurdle near the 1.3155-1.3160 region before aiming to reclaim the 1.3200 round figure and climb to the 1.3265-1.3270 resistance zone.
GBP/USD daily chart
(Click on image to enlarge)
More By This Author:
GBP/USD Consolidates Around Mid-1.3000s, Seems Vulnerable Ahead Of UK DataJapanese Yen Seems Vulnerable Amid Diminishing Odds For More BoJ Rate Hikes
ECB Accounts: Inflation Expected To Rise Again In Latter Part Of This Year


Comments
Log in or sign up to join the conversation.