
The British Pound plunged against the US Dollar after the US Bureau of Labor Statistics (BLS) revealed the US jobs market remains hotter than expected, exceeding the consensus estimates, boosting the Greenback. Therefore, the pair tumbled near the week's lows, with the GBP/USD trading at 1.2722, down 0.53%, at the time of writing.
GBP/USD Price Analysis: Technical outlook
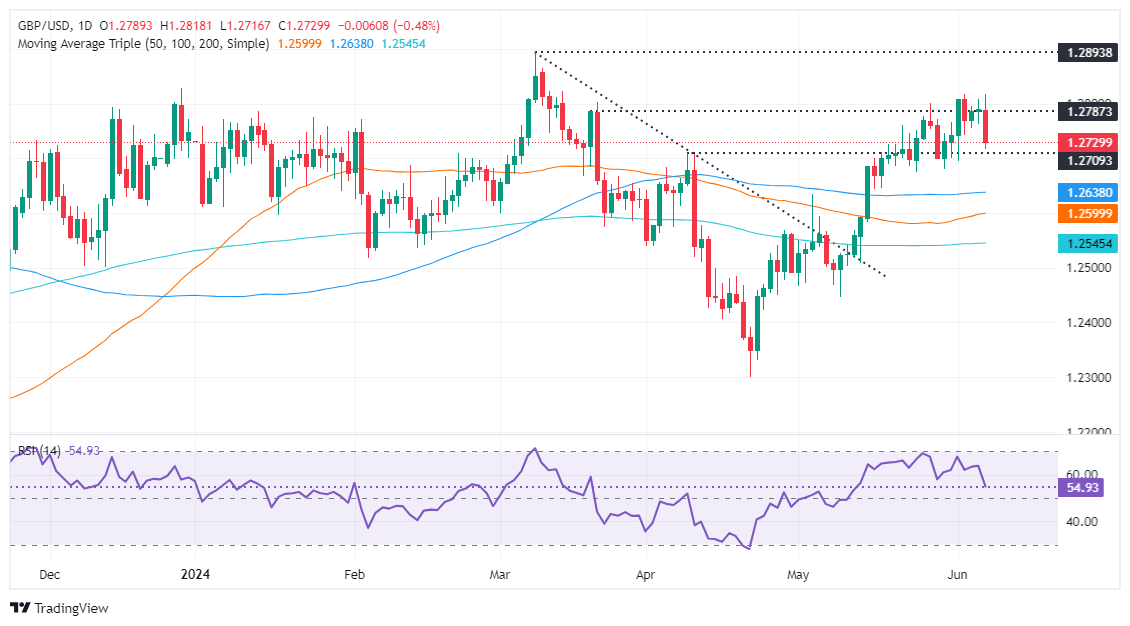
From a technical perspective, the GBP/USD failed to clear strong resistance at the confluence of technical indicators, and sudden US Dollar strength dragged the spot prices below the low of the three-day range of 1.2740.
Momentum has shifted in sellers’ favor in the near term, with the Relative Strength Index (RSI) diving from around 64 to 54.26, about to enter bearish territory.
That said, the first support for GBP/USD would be the 1.2700 figure, followed by last Friday’s low of 1.2694. Further losses are seen beneath at 1.2680, the May 30 low, immediately followed by the May 24 cycle low of 1.2674.
Conversely, if buyers reclaim 1.2740, that could pave the way to keep the pair range-bound at around 1.2750-1.2800.
GBP/USD Price Action – Daily Chart
GBP/USD
| OVERVIEW | |
|---|---|
| Today last price | 1.2726 |
| Today Daily Change | -0.0065 |
| Today Daily Change % | -0.51 |
| Today daily open | 1.2791 |
| TRENDS | |
|---|---|
| Daily SMA20 | 1.2708 |
| Daily SMA50 | 1.2598 |
| Daily SMA100 | 1.2638 |
| Daily SMA200 | 1.2545 |
| LEVELS | |
|---|---|
| Previous Daily High | 1.2809 |
| Previous Daily Low | 1.2763 |
| Previous Weekly High | 1.2801 |
| Previous Weekly Low | 1.2681 |
| Previous Monthly High | 1.2801 |
| Previous Monthly Low | 1.2446 |
| Daily Fibonacci 38.2% | 1.2791 |
| Daily Fibonacci 61.8% | 1.278 |
| Daily Pivot Point S1 | 1.2766 |
| Daily Pivot Point S2 | 1.2741 |
| Daily Pivot Point S3 | 1.2719 |
| Daily Pivot Point R1 | 1.2812 |
| Daily Pivot Point R2 | 1.2834 |
| Daily Pivot Point R3 | 1.2859 |
More By This Author:
Gold Rallies Above $2,370 As Traders Await Crucial US Nonfarm Payrolls Report
Silver Price Analysis: XAG/USD Collapses Below $30.00 As Double Top Emerges
USD/JPY Price Analysis: Slips Below 157.00 As Bearish Engulfing Pattern Looms


Comments
Log in or sign up to join the conversation.