
GBP/USD: Bullish Breakout From Ascending Triangle? Sterling Set To Benefit From Biden
Blue Monday has passed and optimism prevails – markets have been cheering President Joe Biden’s message of unity and optimism. The rise in shares has pushed the safe-haven dollar down, allowing GBP/USD to hold onto 1.37. Can it continue higher?
The new Commander-in-Chief has been busy signing Executive Orders, such as readmitting the US to the Paris climate agreement and undoing additional policies by Donald Trump, his predecessor. Investors are more focused on Biden’s fiscal stimulus plan worth $1.9 trillion. The new administration’s drive and the sense of collaboration – at least for now – raises the chances of passing the relief package.
Republicans and Democrats may receive a reminder of the need to support the world’s largest economy with Thursday’s Unemployment Claims. Last week, applications leaped to 965,000, the worst since August. The figures for the week ending January 15 – which is when the Nonfarm Payrolls surveys are held – are forecast to show a minor decline. Unless claims drop back below 800,000, the pressure on lawmakers to act would remain immense.
Biden’s stimulus proposal includes funds for speeding America’s vaccination campaign. Britain is the leader in the Western world’s immunizations, with over 340,000 receiving their first shot on Tuesday – a record so far. However, the UK also hit a new and grim daily death record – 1,820 lost their lives on Tuesday.
The battle between the virus – and its fast-spreading variant – and the jabs continues at full speed. Israel, the world leader in inoculation, is yet to see a substantial drop in coronavirus cases.
Markets are currently shrugging off economic indicators and remain focused on stimulus on both sides of the Atlantic, as well as coronavirus developments.
GBP/USD Technical Analysis
(Click on image to enlarge)
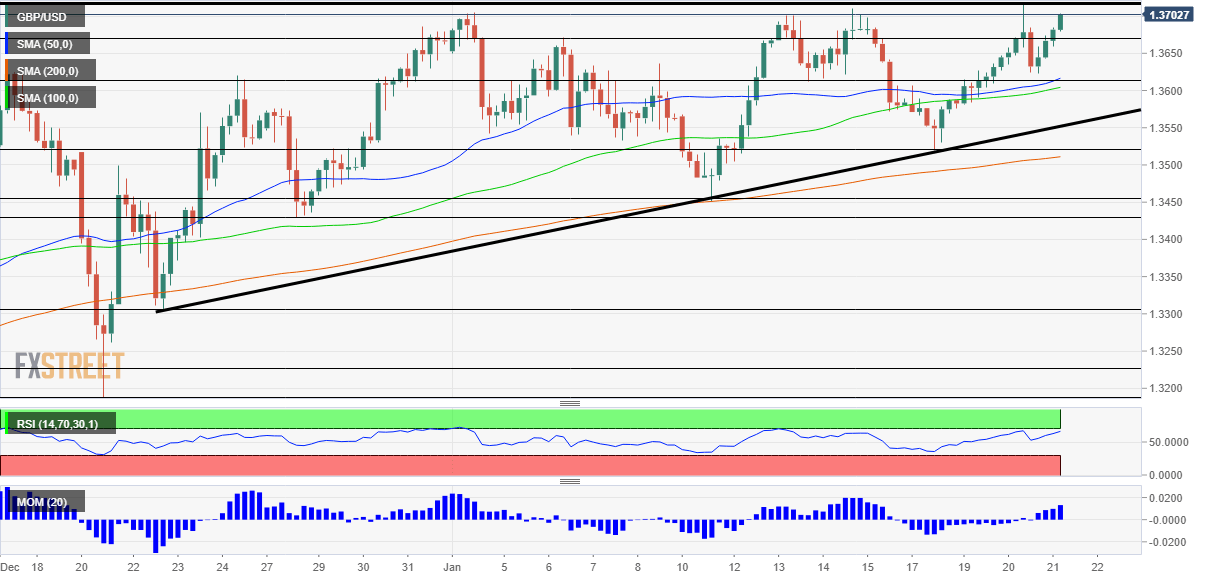
Pound/dollar has been rising in an ascending triangle pattern – a bullish sign. According to technical textbooks, a substantial upside breakout is on the cards. Momntum on the four-hour chart is to the upside and the currency pair is trading above the 50, 100 and 200 Simple Moving Averages.
The obvious resistance line is 1.3719, the highest level GBP/USD hit since 2018. It is followed by 1.3810 and 1.40.
Support awaits at around 1.3675, followed by 1.3620 and 1.3530. All were stepping stones on the way up.
Disclaimer: Foreign exchange (Forex) trading carries a high level of risk and may not be suitable for all investors. The risk grows as the leverage is higher. Investment objectives, risk ...
more

