
Gas Giant Golar LNG. Is Our Top Upgrade
Golar LNG (GMLP) is our top-rated upgrade this week.
|
Ticker |
Company Name |
Market Price |
Valuation |
Last 12-M Return |
1-M Forecast Return |
1-Yr Forecast Return |
P/E Ratio |
Sector Name |
|
GOLAR LNG PARTN |
19.29 |
-26.10% |
14.75% |
1.14% |
13.76% |
6.50 |
Oils-Energy |
|
|
HEALTH INS INN |
5.61 |
-32.84% |
14.72% |
1.13% |
13.56% |
8.77 |
Finance |
|
|
SUNCOKE ENERGY |
15.12 |
9.46% |
35.48% |
1.09% |
13.08% |
8.11 |
Oils-Energy |
|
|
AMER RAILCAR |
38.97 |
-11.97% |
8.92% |
0.76% |
9.08% |
7.61 |
Transportation |
|
|
SUMMIT MIDSTRM |
23.1 |
-27.23% |
31.85% |
0.68% |
8.12% |
27.28 |
Oils-Energy |
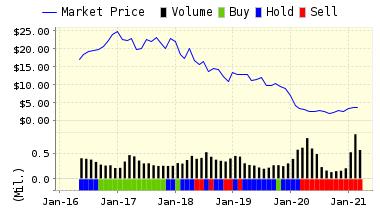
Below is today's data on Golar LNG (GMLP):
Golar LNG Partners LP is a limited partnership primarily focused on owning and operating floating storage and regasification units (or FSRUs) and LNG carriers under long-term charters. Golar LNG Partners LP is based in Hamilton, Bermuda.
Recommendation: We updated our recommendation from BUY to STRONG BUY for GOLAR LNG PARTN on 2016-09-23. Based on the information we have gathered and our resulting research, we feel that GOLAR LNG PARTN has the probability to OUTPERFORM average market performance for the next year. The company exhibits ATTRACTIVE P/E Ratio and Momentum.
|
ValuEngine Forecast |
||
|
Target |
Expected |
|
|---|---|---|
|
1-Month |
19.51 | 1.14% |
|
3-Month |
19.56 | 1.39% |
|
6-Month |
19.44 | 0.79% |
|
1-Year |
21.94 | 13.76% |
|
2-Year |
18.10 | -6.18% |
|
3-Year |
12.86 | -33.32% |
|
Valuation & Rankings |
|||
|
Valuation |
26.10% undervalued |
Valuation Rank |
|
|
1-M Forecast Return |
1.14% |
1-M Forecast Return Rank |
|
|
12-M Return |
14.75% |
Momentum Rank |
|
|
Sharpe Ratio |
-0.19 |
Sharpe Ratio Rank |
|
|
5-Y Avg Annual Return |
-5.61% |
5-Y Avg Annual Rtn Rank |
|
|
Volatility |
29.80% |
Volatility Rank |
|
|
Expected EPS Growth |
-6.18% |
EPS Growth Rank |
|
|
Market Cap (billions) |
0.88 |
Size Rank |
|
|
Trailing P/E Ratio |
6.50 |
Trailing P/E Rank |
|
|
Forward P/E Ratio |
6.93 |
Forward P/E Ratio Rank |
|
|
PEG Ratio |
n/a |
PEG Ratio Rank |
|
|
Price/Sales |
1.99 |
Price/Sales Rank |
|
|
Market/Book |
1.86 |
Market/Book Rank |
|
|
Beta |
1.02 |
Beta Rank |
|
|
Alpha |
-0.12 |
Alpha Rank |
|
Market Overview
|
Summary of VE Stock Universe |
|
|
Stocks Undervalued |
51.95% |
|
Stocks Overvalued |
48.05% |
|
Stocks Undervalued by 20% |
20.77% |
|
Stocks Overvalued by 20% |
16.12% |
Sector Overview
|
Sector |
Change |
MTD |
YTD |
Valuation |
Last 12-MReturn |
P/E Ratio |
|
Multi-Sector Conglomerates |
-0.68% |
-0.90% |
7.32% |
16.34% overvalued |
5.64% |
20.13 |
|
Computer and Technology |
-0.26% |
2.07% |
17.65% |
5.35% overvalued |
11.29% |
29.51 |
|
Industrial Products |
-0.56% |
1.33% |
17.46% |
4.96% overvalued |
13.35% |
23.19 |
|
Utilities |
-0.26% |
2.09% |
12.51% |
4.51% overvalued |
19.07% |
22.42 |
|
Consumer Staples |
-0.18% |
0.50% |
11.30% |
3.53% overvalued |
15.74% |
24.46 |
|
Basic Materials |
-0.90% |
1.16% |
46.81% |
3.41% overvalued |
67.07% |
30.61 |
|
Oils-Energy |
-1.30% |
-0.05% |
29.26% |
2.65% overvalued |
-3.75% |
24.76 |
|
Aerospace |
0.03% |
2.14% |
1.44% |
1.53% overvalued |
8.53% |
18.38 |
|
Finance |
-0.23% |
0.62% |
7.75% |
0.65% overvalued |
7.32% |
16.58 |
|
Consumer Discretionary |
-0.12% |
1.16% |
9.77% |
0.27% undervalued |
3.83% |
23.64 |
|
Business Services |
-0.90% |
0.65% |
14.62% |
0.88% undervalued |
-0.17% |
24.80 |
|
Medical |
-0.26% |
3.27% |
2.97% |
3.06% undervalued |
-10.39% |
27.41 |
|
Construction |
-0.21% |
-0.12% |
31.56% |
4.38% undervalued |
14.54% |
20.23 |
|
Auto-Tires-Trucks |
-0.51% |
1.72% |
6.60% |
5.24% undervalued |
11.04% |
13.77 |
|
Transportation |
-0.61% |
0.03% |
11.82% |
5.78% undervalued |
-12.04% |
15.09 |
|
Retail-Wholesale |
-0.09% |
0.50% |
2.23% |
7.29% undervalued |
-1.98% |
22.40 |
Valuation Watch: Overvalued stocks now make up 48.05% of our stocks assigned a valuation and 16.12% of those equities are calculated to be overvalued by 20% or more. Nine sectors are calculated to be overvalued.
Disclaimer: ValuEngine.com is an independent research ...
more

