
Further GameStop Momentum Makes Russell Outperform, But Now Look Out For A Major Market Peak
Summary
- The GME momentum higher will probably continue for some more days, even weeks. The Russell 2000 will continue to outperform in that case.
- This GME story is unlikely to morph into a Lehman style of market dislocation. More likely, some type of LCTM rescue/bail-out will be engineered by the Federal Reserve.
- Some of the short-selling hedge funds will disappear - bankrupted or bought out (likely pennies on the dollar). When that happens, the GME rally/momentum will break.
- If a GME resolution happens within the next two weeks, it will coincide with the peak in liquidity flows, and the subsequent, seasonal liquidity drought will weaken equities and long bond yields until late March (we will reappraise as more liquidity data comes in).
- Global liquidity, especially that coming from China, is set to go sideways to lower until late 2021 at least. That will crimp the evolution of cryptos/bitcoin, which will probably end the year lower from the highs we have seen several weeks ago.
Long bond yields (10-year yield) rose strongly on Friday, Jan. 29, giving short shrift to speculations that the GameStop (NYSE:GME) battle between Hedge Funds, which shorted the stock, and so-called "WallStreetBets meme traders" is about to become a systemic risk for the financial markets.
As we argue later in the article, this may not necessarily be true - we foresee a bail-out operation analogous to the LCTM rescue of September 1998. That will destroy some of the hedge funds involved in shorting GME stock, but it also will devastate some, or even many, of the "Reddolutionists" which took on the hedge funds. And resolution of the GME saga will weaken the underpinnings of the market, and that may exacerbate the negative impact of a global and domestic liquidity drought which is due at the middle of February 2021.
We believe that yields are rising because GME, Plug Power (Nasdaq:PLUG) (now composing the largest weightings in the Russell 2000) will likely continue to rise for a little longer, following the sharp rise in yields on Friday, as the chart below illustrates.
Regression of the Covariance of 10-Year Yield, Russell 2000, GME, PLUG
With Yields rising, the Russell 2000 is the best choice to go long equities, if GME and PLUG resume their rise.
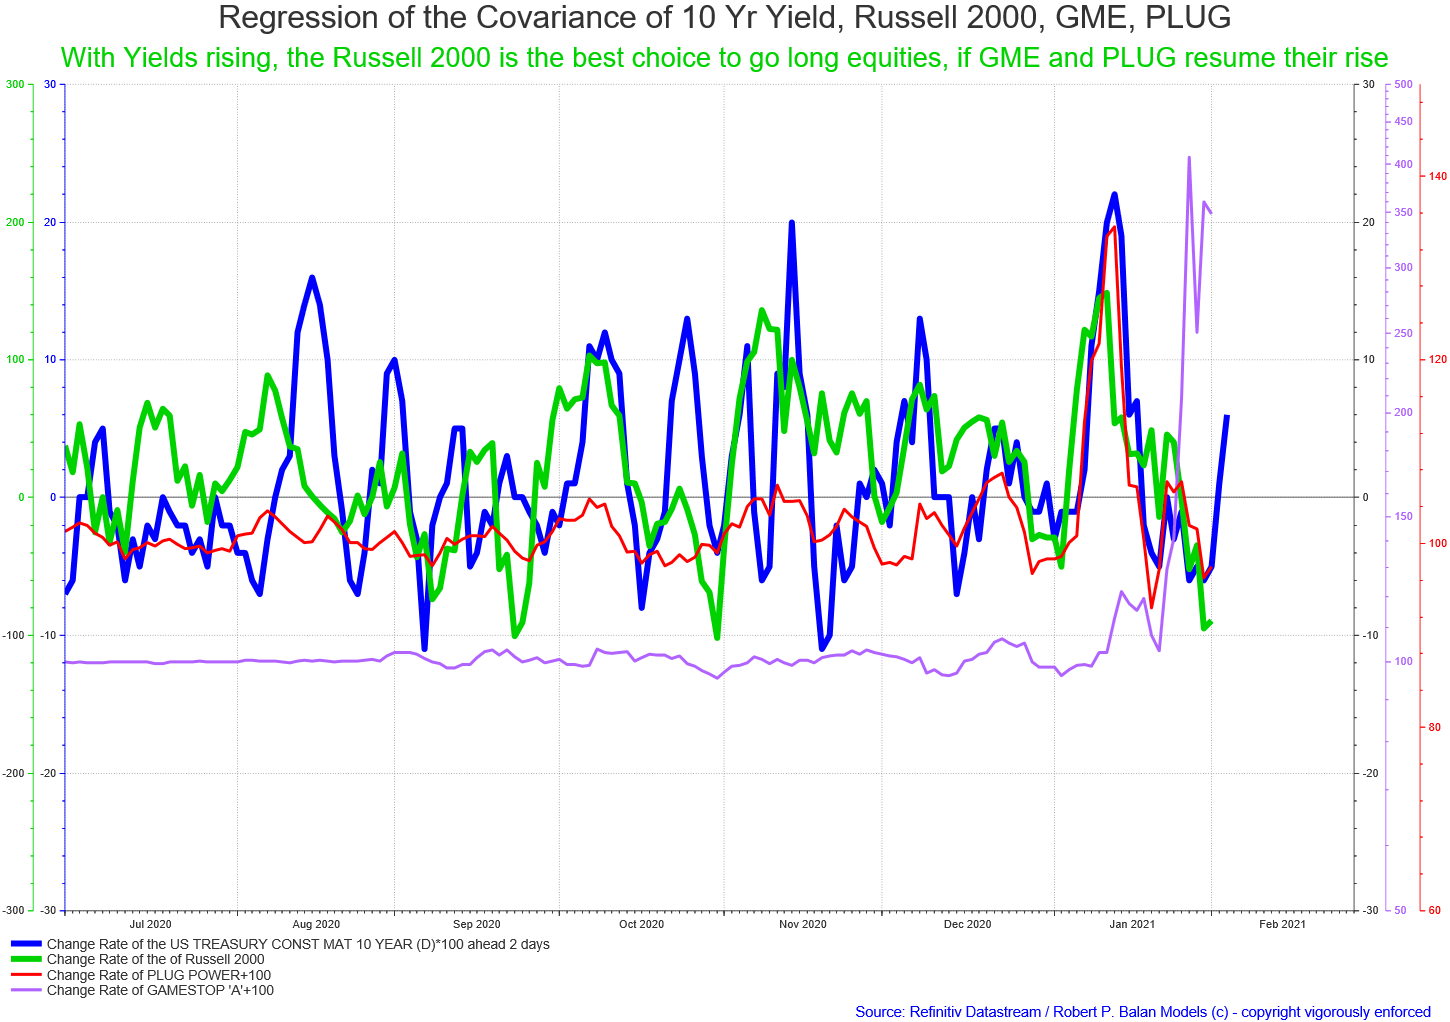
Also, for the (much larger) rest of the equity universe, tech earnings season winds down Feb. 2, and Amazon (Nasdaq:AMZN) should have very good/excellent numbers, and those bits and pieces could buoy equities as well - more reason for yields to rise further. Moreover, IRA inflows are due until Feb. 5, inflows which could tip the market balance higher in the very short term.
The various ramifications of the GME saga may not be optimal for other indices (which may be sold to meet margin calls), but that will provide an opportunity for Russell 2000 outperformance. The whippy end of the tech earnings season should also see Nasdaq 100 performing well. The Russell 2000 and Nasdaq 100 March 2021 futures contracts (RTYH1 and NQH1) are what we are buying Monday.
The "Masters of the Universe" not signaling immediate systemic risk
Also, we believe that yields are rising because the bond market and Primary Dealers are not seeing any Lehman Bros. event, but probably a Long-Term Capital Management (LTCM) style bail-out, but with no immediate systemic risks, as said earlier.
The situation was summarized by @RM13 (a veteran investor with the PAM community) that "the delta neutral positioning shows little stress, but once this month's inflows are in by about Feb 4-5th, the market is left to its own universe of seasonality. IRA inflows come in at the beginning of the month, are placed into the equity market . . . but all the big earnings are over; AMZN is done on Feb 2nd. We are left with seasonality, new administration jitters, COVID variants, and uncertainty of SEC oversight over GME and related shorts."
That is not to say that a bail out is cut-and-dried. There are still good odds of the situation deteriorating if the Federal Reserve does not step in quickly. The prospects of that happening soon got a little murky when Fed Chair Jerome Powell demurred when asked about the GME situation. But the Fed will be at the front and center of this titanic battle between David and Goliath before long.
The "revolution" will eat many of its children
And in the end, both the short sellers and the meme traders will be damaged by the time this amazing take down of the hedge funds get final resolution. Some of the short-sellers will disappear - become bankrupt, or will be bought out. Sadly, many of the meme trader late-comers will be wiped out too. Many of the "WSB warriors" will make money (even life-changing minor fortunes), but the "revolution" will eat many of its children. That's how zero-sum games work.
It only takes one enterprising early-comer (probably another hedge fund, the WallStreetBets veterans, or why not BlackRock?) to yell "fire" and take profit, and there will be a stampede toward the exits. Many of the naive late comers (the "cannon fodder" of the more savvy WSB "autists") will not get to see their paper profits - many will be wiped out too. These "cannon fodders" will very likely be part of the exit strategy of the WSB masterminds.
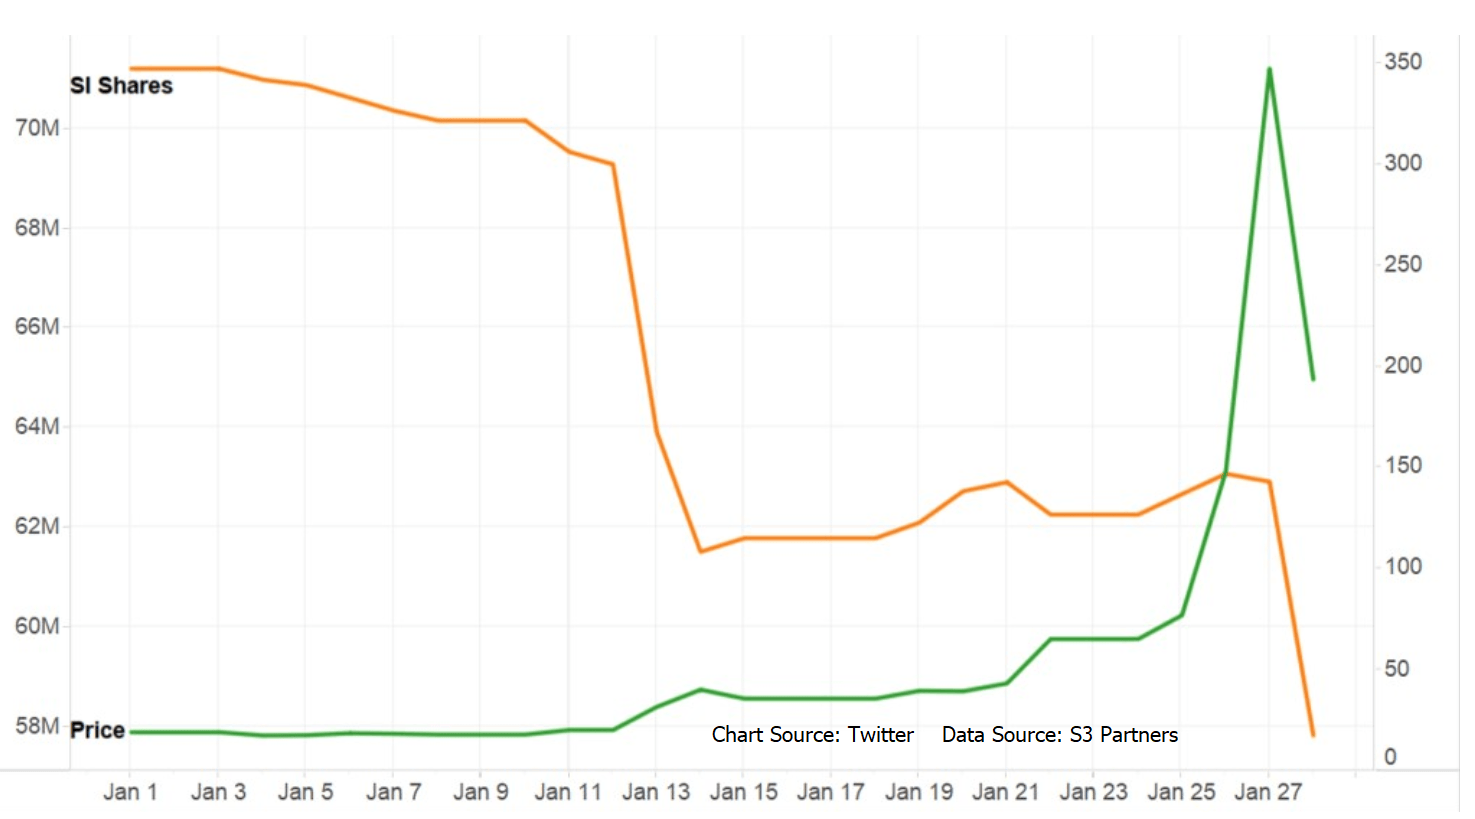
As of Thursday, short interest has not moved at all that much, so the battle continues. The short sellers look to be digging in - but the WallStreetBets meme traders look just as resolute. However, that nominal short interest data shown above may not be as useful in gauging the true extent of the hedge funds short exposure (and pain threshold). These headline short interest numbers are likely net delta flat to the in the money GEM call holders, and therefore won't be squeezed in any way.
The short sellers are still not hurting enough, more joining the fray
There's therefore a possibility that these headline numbers are overstated, especially after short holders are said to have degrossed when GME prices fell on Thursday after Robinhood and other brokers curtailed new longs on GME and other shorted stocks. Short open interest have declined by just 5 million shares over the last week, falling by 8%. Put another way, the short sellers bought some time, and may still have a lot of fight left in them. There also were stories from mainstream media (such as CNBC) that new hedge funds have joined the fray and are willing to bet against GME stock. It's turning into class warfare.
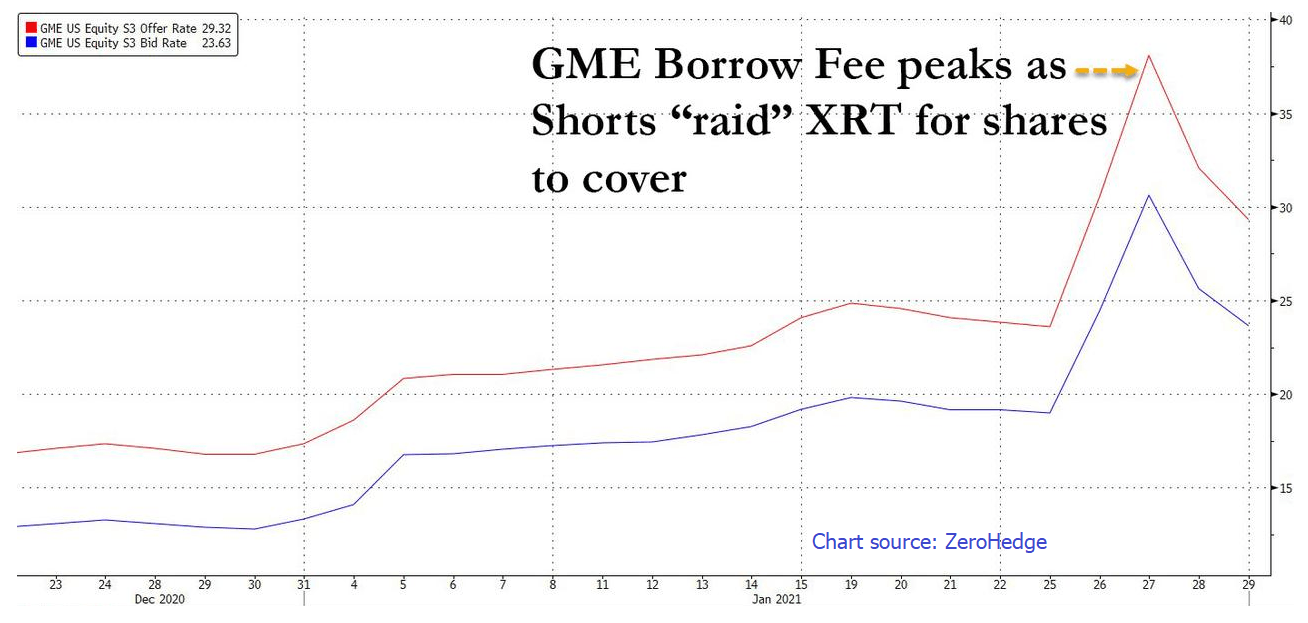
Nonetheless, we wonder how the short sellers can keep on playing (and paying margin calls) - maybe their options are now severely limited as the cost to borrow GME stock had exploded as high as 200%, virtual death sentence for any hedge fund who plans to keep the GME short on for a long period of time. However, cost to borrow GME stock has moderated to 30% after the raid on XRT GME stock holdings (see chart below), when $700 million worth of 300,00 GME shares were pulled from the ETFs assets. The bad news to the short-sellers is that there are no more GME shares to raid.
For all of these reasons, the GME squeeze and upwards momentum will likely continue for some time - a few days, maybe two weeks. Any kind of resolution will damage the market underpinnings to some degree, and the worrisome part is that a global and domestic systemic liquidity seasonal drought is about to take place.
The GME perturbation may coincide with onset of global, seasonal liquidity drought
What we fear is that the market may be weakened at a time when the downward pull of declining liquidity (both global and domestic) begins to act on the markets. Market instability further exacerbated by liquidity drought is a very toxic combination. We could easily see a mini-Minsky Moment with such combination of factors.
The key thing to watch is the behavior of the long bond yield, which is very sensitive to adverse market developments. And so far, yields are indicating risk on.
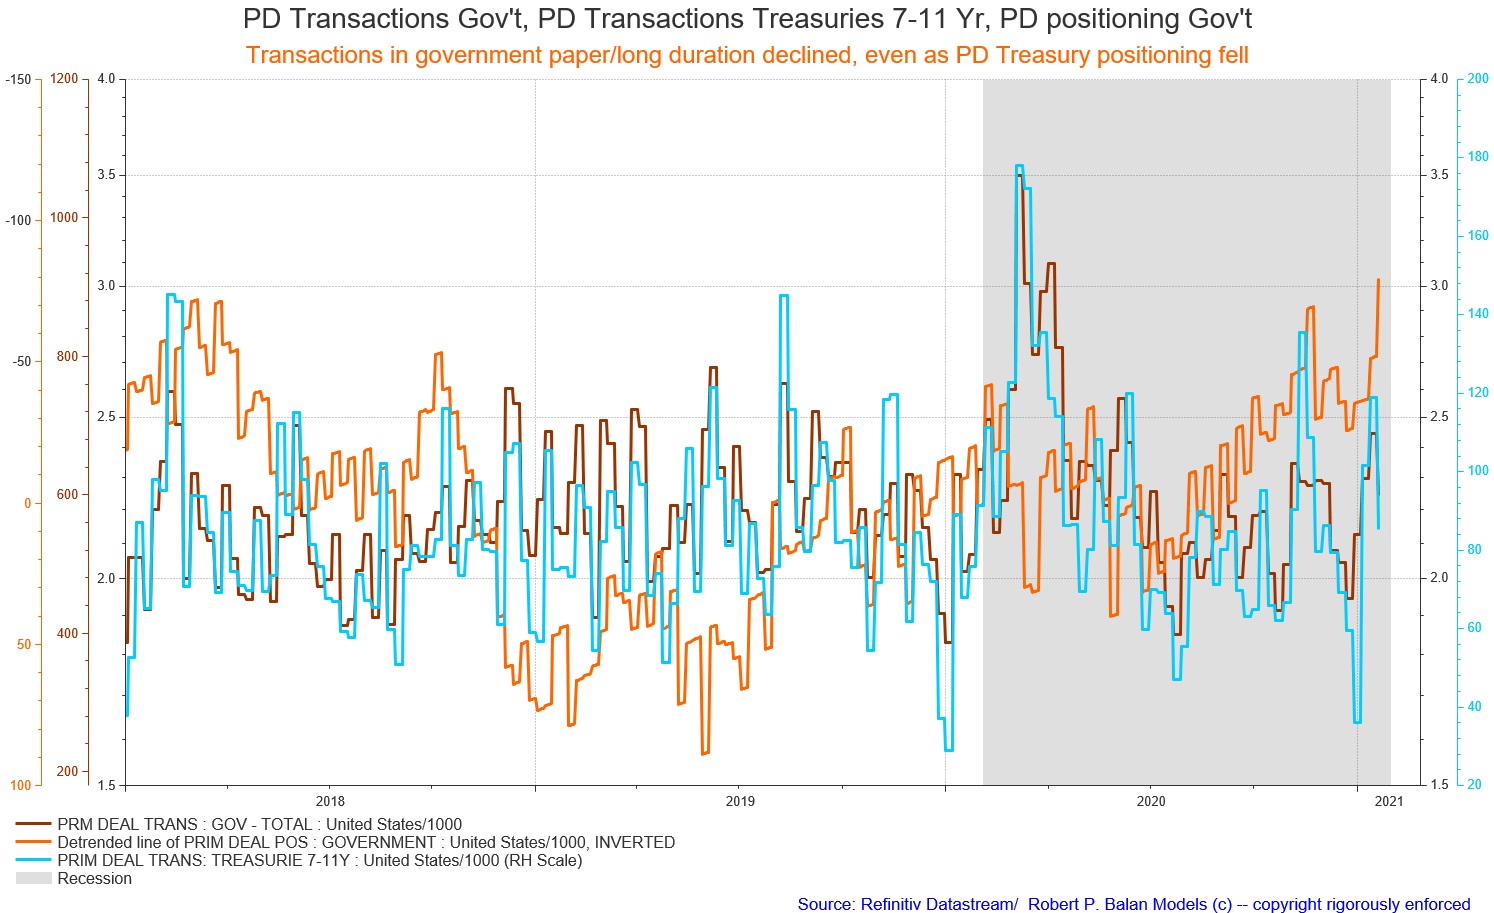
The bond market is still hewing to this template (see chart below), so it might be a case of rising yields for a few more days. If the Treasury Cash Balance (TCB, purple line) continues to turn lower, we could see an inflection point of flows by next week. The actual inflection of the nominal values/prices of equities may come a few days later. That should lead to significantly lower yields and lower equities over the next several weeks, if we got this one right.
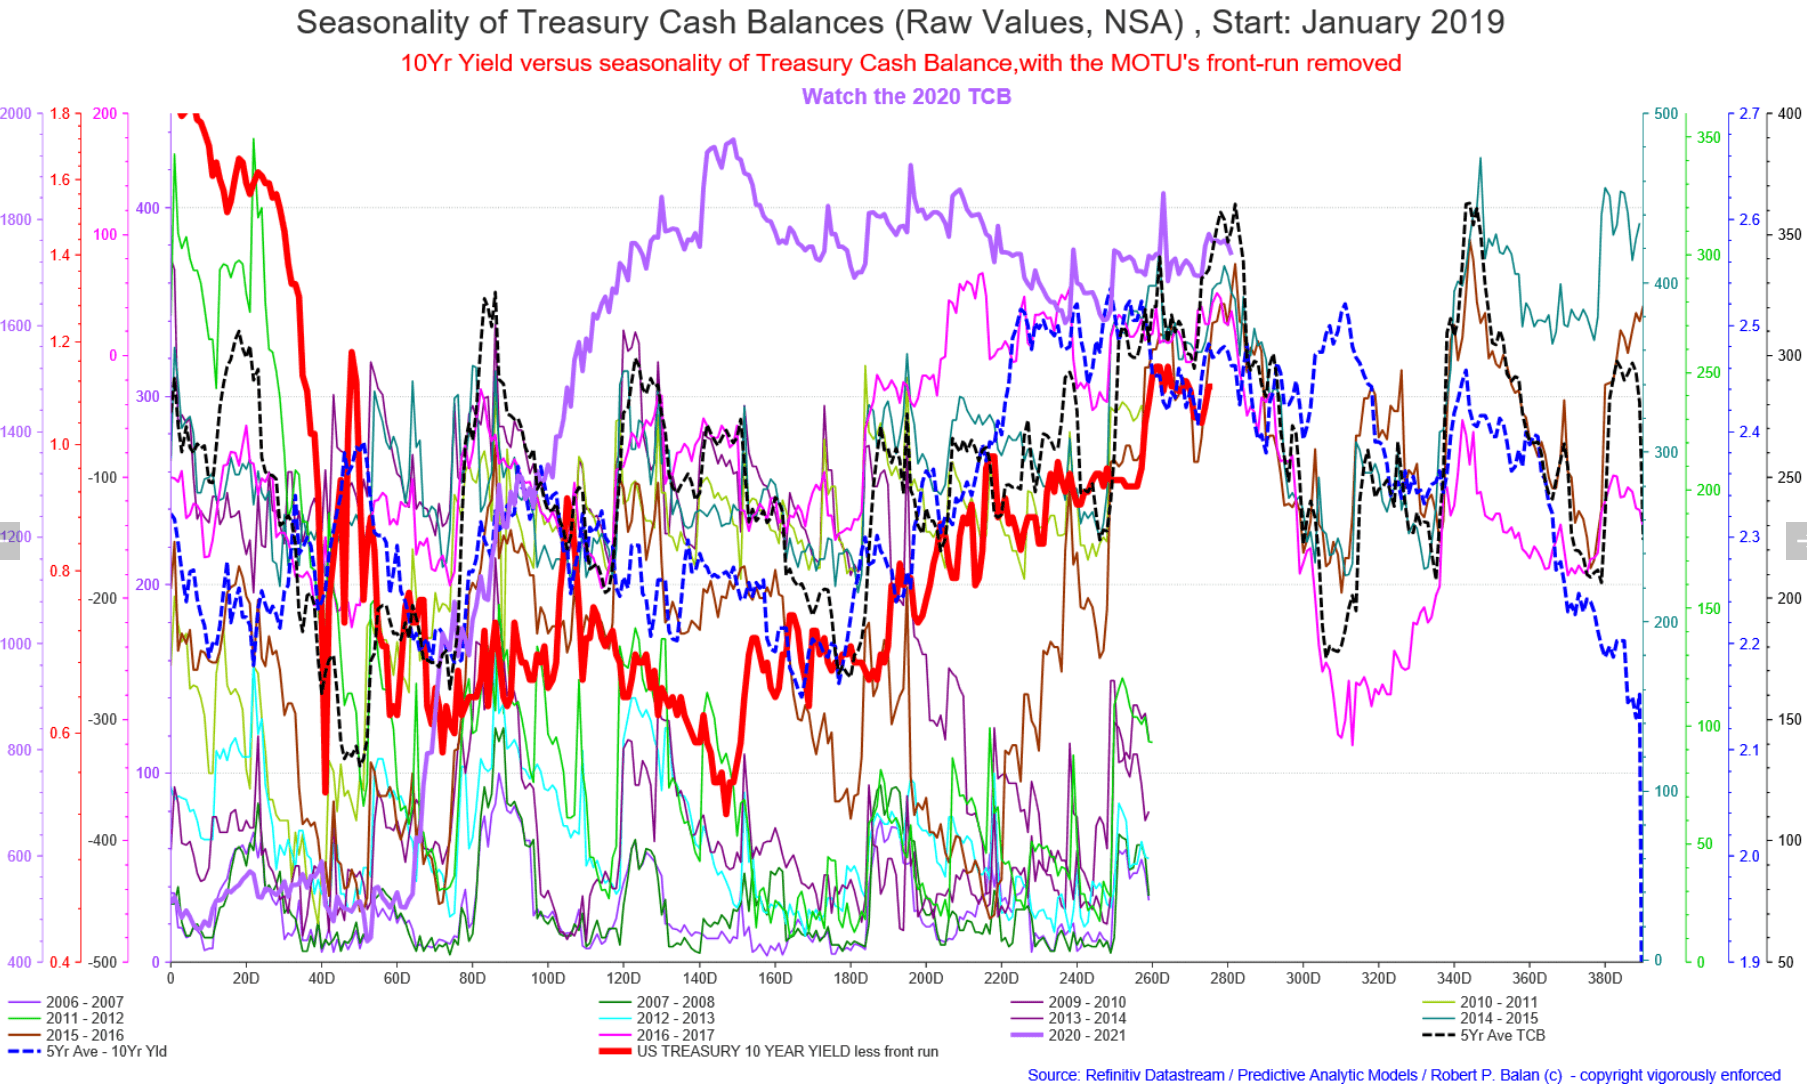
Our "canary in the mine" is the long bond yield and the position taken by the Primary Dealers (the MOTUs) in governments and long duration Treasuries. So far, they are selling Treasury paper to anyone who wants them (see chart below). Over the years, I've seen that these are the people who will know first if the market has technical or operational reasons to crash. When they start hoarding government paper, and if the change rate in the transaction volumes fall sharply - then look out below.
Rising yields due to TCB seasonality has a counterpart in the equity universe. We have noted a few times at PAM reports that TCB seasonality has a great influence on the changes in long-term bond yields. Equities movements are more complex, as changes in this universe are impacted by the changes in all three major sources of systemic liquidity: SOMA Transactions (the Fed's Balance Sheet, Bank Reserves (BRS), and the Treasury Cash Balance (TCB).
The individual seasonality of these three liquidity sources do not sync, so the analytical challenge is to find the commonality of their flows signatures. We do that "nesting" process to look for the optimal (averaged) liquidity inflection point, assuming that the corresponding inflection points of changes in equities will match. These optimized liquidity points do not always coincide with the inflection points of equities, but coincidence happens often enough to make this analytical approach very viable.
For instance, juxtaposition of the (adjusted) seasonality of SOMA Transactions, Bank Reserves and the TCB vs. the seasonality of the S&P 500 Index provides several actionable information (see chart below).
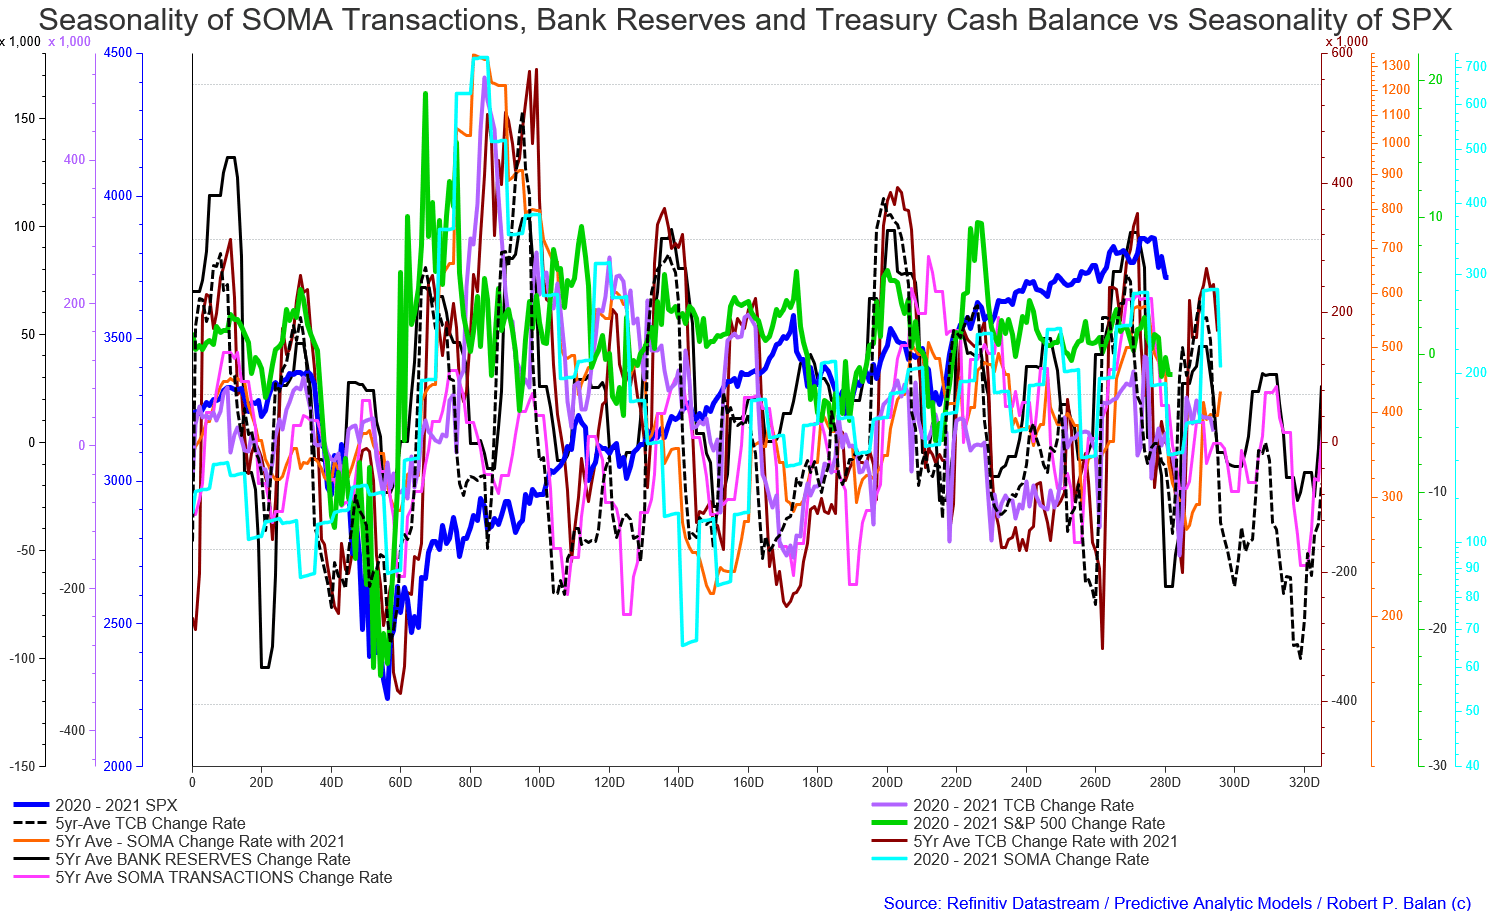
The liquidity flows have bottomed several days ago, and the SPX change rate and nominal value are catching up, on a lagged basis. Note the behavior of the SPX change rate, as it is the link of the nominal SPX share price to the liquidity flows, e.g., flows to flows, making comparison mathematically viable.
This aggregated approach provide the same information provided by the TCB versus 10yr yield construct - further equity and yield rallies for the next 5 to 10 trading days, and then a larger decline in both equities, and long-term, bond yields. The bottom of this projected large decline is 37 to 42 trading days from Monday, February 1, 2020.
Other constructs also show that the markets are very vulnerable short term
There's another model which we have shown, on and off in PAM reports - and that is the convergence of the changes in cryptos, metals, and equities during certain critical liquidity inflections points.
(Click on image to enlarge)
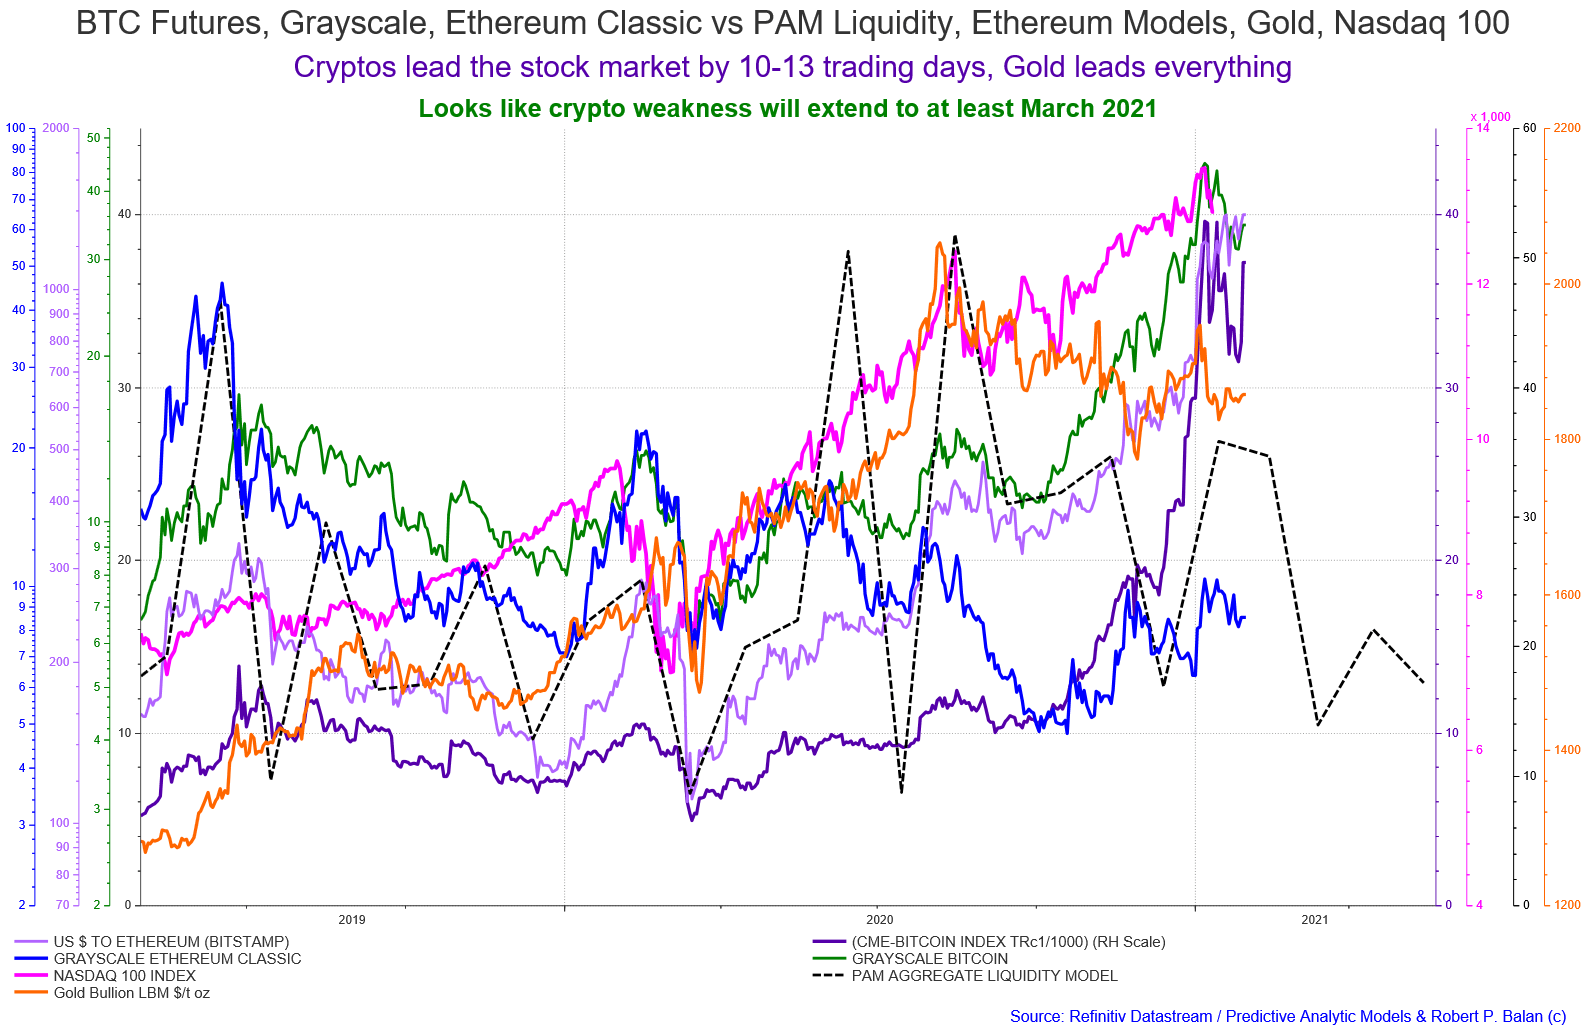
This is PAM's crypto model which we have been showing for a number of years (I first showed it to PAM members in July 2018). The chart above shows an aggregate global liquidity model and its juxtaposition with several asset classes. But earlier this year, we realized that liquidity from China is driving the model shown above. Therefore, we are now supplementing this global liquidity model with a China-centric approach (see chart below).
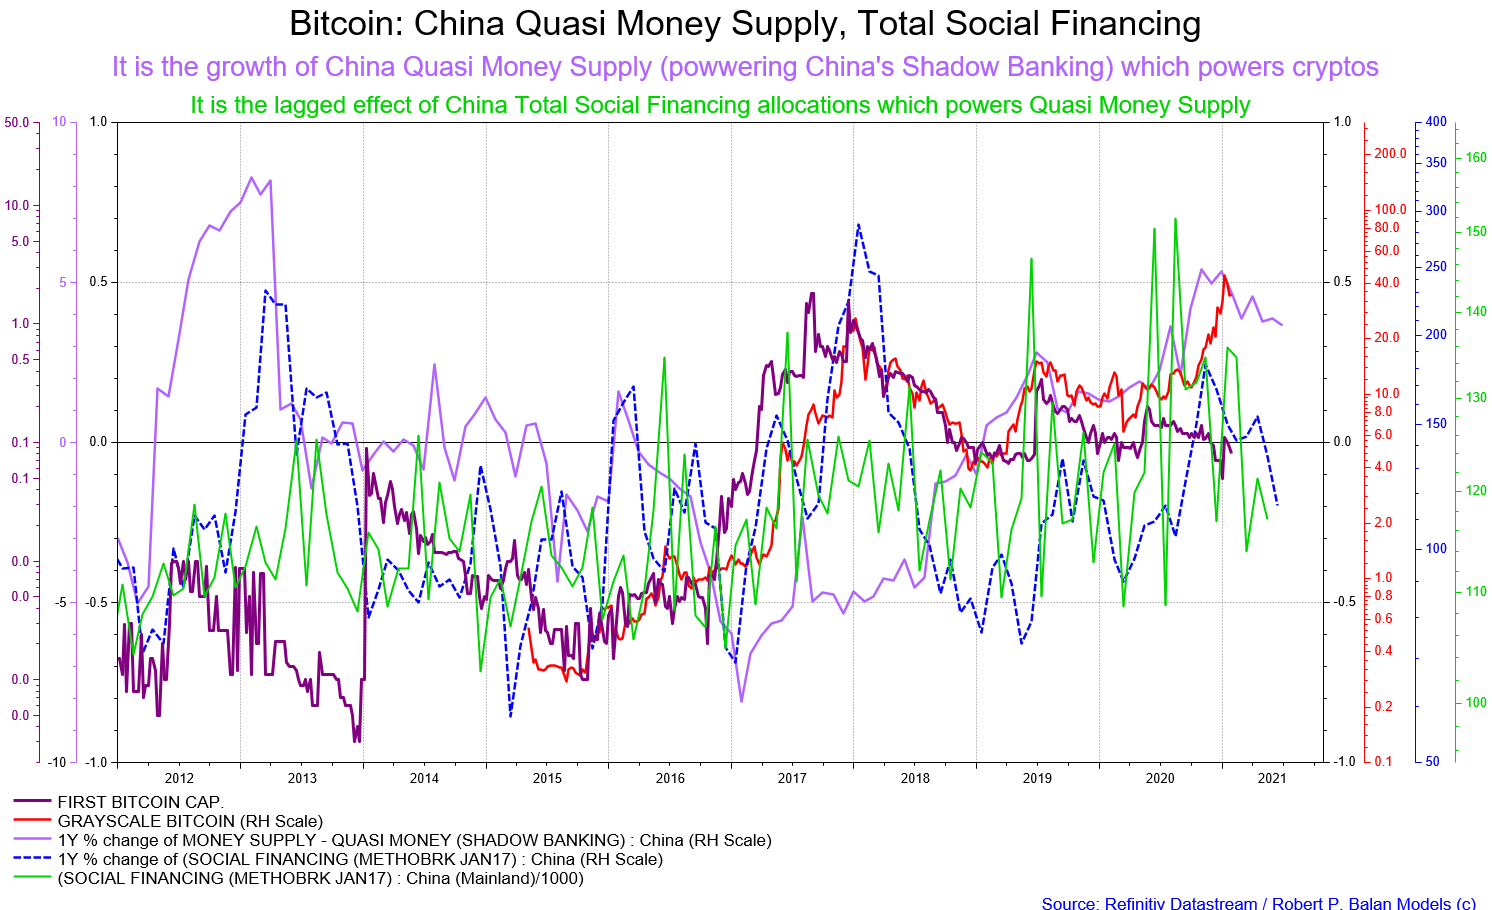
And if we are to juxtapose the liquidity being produced by China shadow banking - the Quasi Money Supply - then we could see its interesting parallels with crypto/bitcoin price development. Quasi Money Supply stems from the country's Total Social Financing program. In which case then, a consolidation period in crypto/bitcoin could last at least until May, this year.
This is where it gets more interesting. Total Social Financing is the real-time funding of the Five-Year Government (Budgeted) Expenditures approved/reaffirmed by the Communist Party plenum in December every year. This to us is looking like the Big Kahuna of cryptos/bitcoin funding source, or at least, the template of fund flows into cryptos.
Finally, global liquidity flows from the balance sheet of G5 central banks (Federal Reserve, ECB, BoJ, PBoC and SNB) have been severely cut nine months ago - and the lagged impact of that liquidity outflow will soon manifest in the financial markets (see chart below).
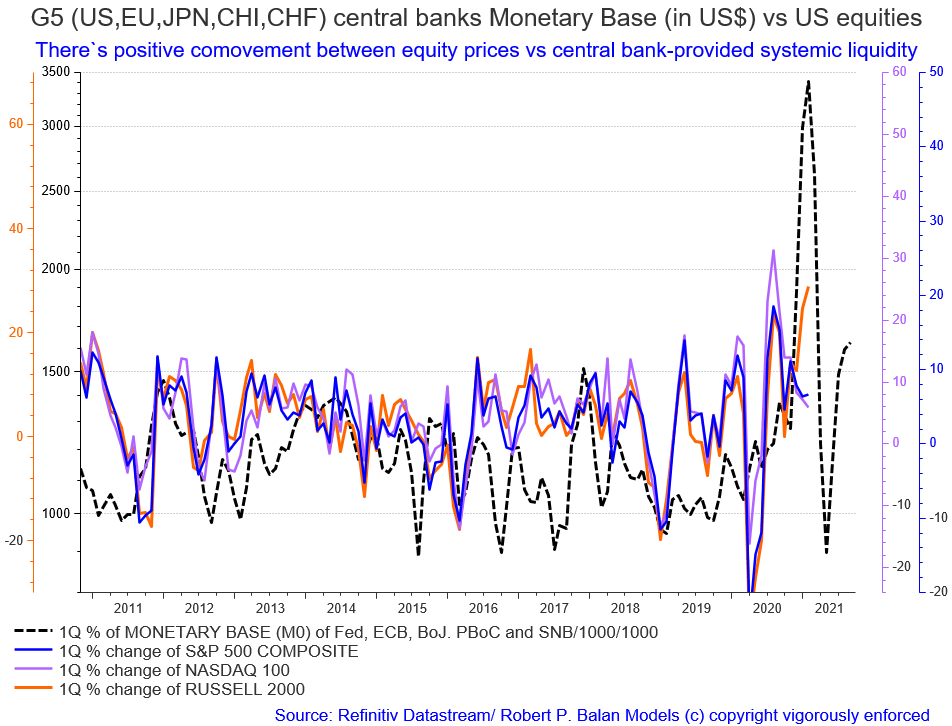
If the implications of the liquidity outflows on asset prices will manifest again, risk asset prices should be on a downtrend until May, under this construct. And the magnitude of the pullback could be quite large (see chart above).
------------------------------------------------------------------------------------


