
Friday's Sell-Off - New Downtrend Or Just Correction?
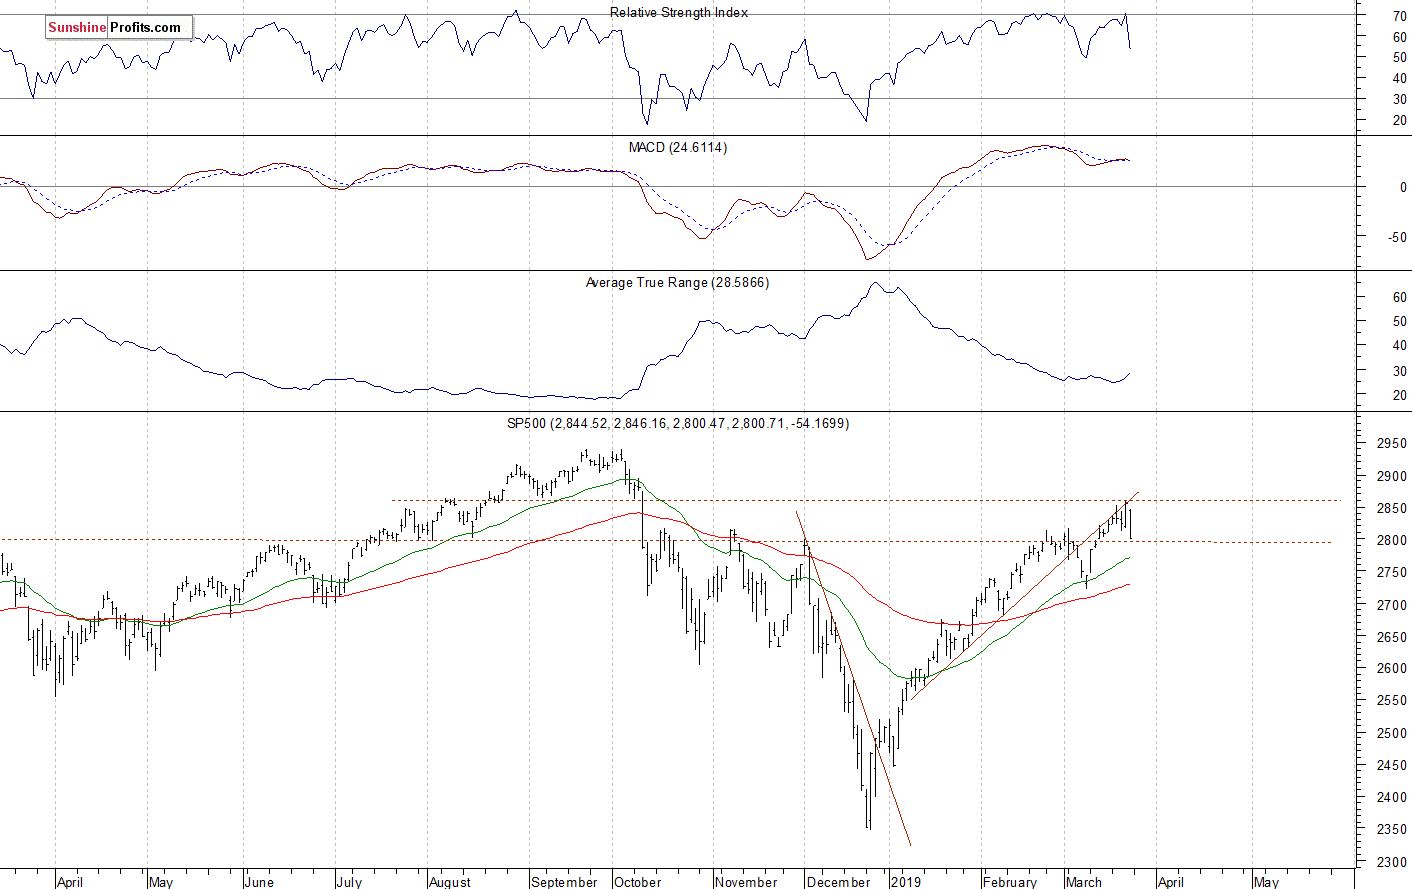
The U.S. stock market indexes lost 1.8-2.5% on Friday, as investors' sentiment worsened following some global economic data releases. The S&P 500 index retraced more of its October-December downward correction of 20.2% recently. The broad stock market's gauge traded just around 3% below September the 21st record high of 2,940.91. But then it got close to the 2,800 mark again. The Dow Jones Industrial Average lost 1.8% and the Nasdaq Composite lost 2.5% on Friday.
The nearest important resistance level of the S&P 500 index is now at around 2,820, marked by the recent support level. The next resistance level is at 2,850-2,860, marked by the early October local lows. On the other hand, the support level is now at 2,800, marked by the recent resistance level and the daily gap up of 2,798.32-2,799.78. The support level is also at 2,785, marked by the daily gap up of 2,784.00-2,786.73.
The broad stock market retraced all of its December sell-off and it broke above the medium-term resistance level of around 2,800-2,820, marked by the October-November local highs recently. So is it still just a correction or a new medium-term uptrend? The market broke above the 61.8% Fibonacci retracement of the 20% decline. And we may see an attempt at getting back to the record highs. But will the index continue much higher above the mentioned previous local highs? Friday's trading session cast some doubts on bulls' power. However, there have been no confirmed negative medium-term signals so far. The index bounced off the previously broken two-month-long upward trend line:
Mixed Expectations Following Friday's Decline
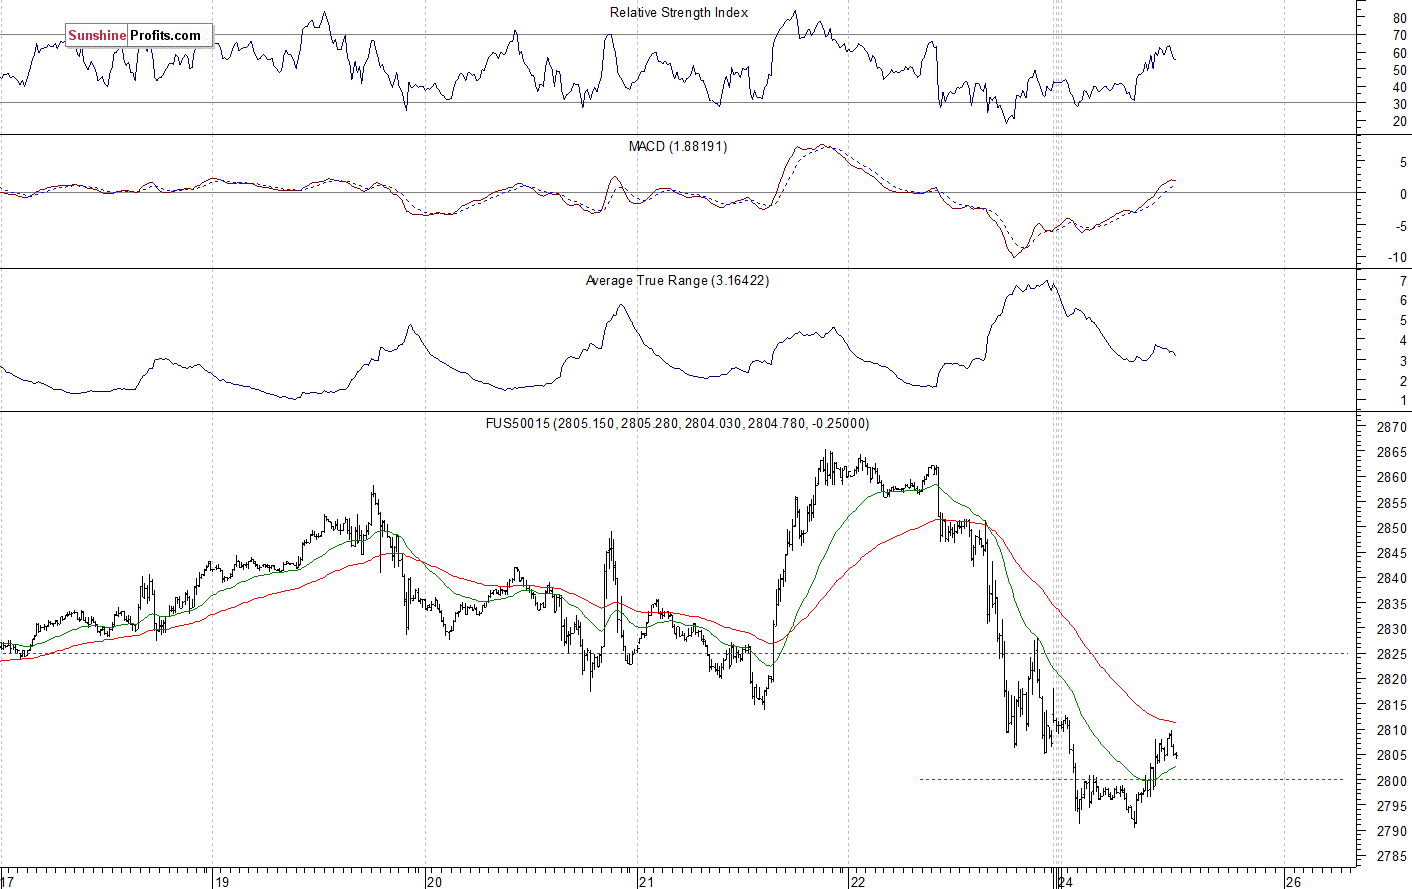
Expectations before the opening of today's trading session are negative because the index futures contracts trade 0.2-0.6% below their Friday's closing prices. The European stock market indexes have lost 0.2-0.3% so far. There will be no new important economic data announcements today. The broad stock market will likely fluctuate following the Friday's sell-off. However, if the index breaks below the 2,800 mark, we could see more selling pressure.
The S&P 500 futures contract trades within an intraday uptrend, as it retraces some of its overnight decline. The nearest important level of resistance is now at 2,820-2,830, marked by the local highs. On the other hand, the support level is at 2,790, marked by the overnight low. The futures contract trades along the late Friday's local lows, as we can see on the 15-minute chart:
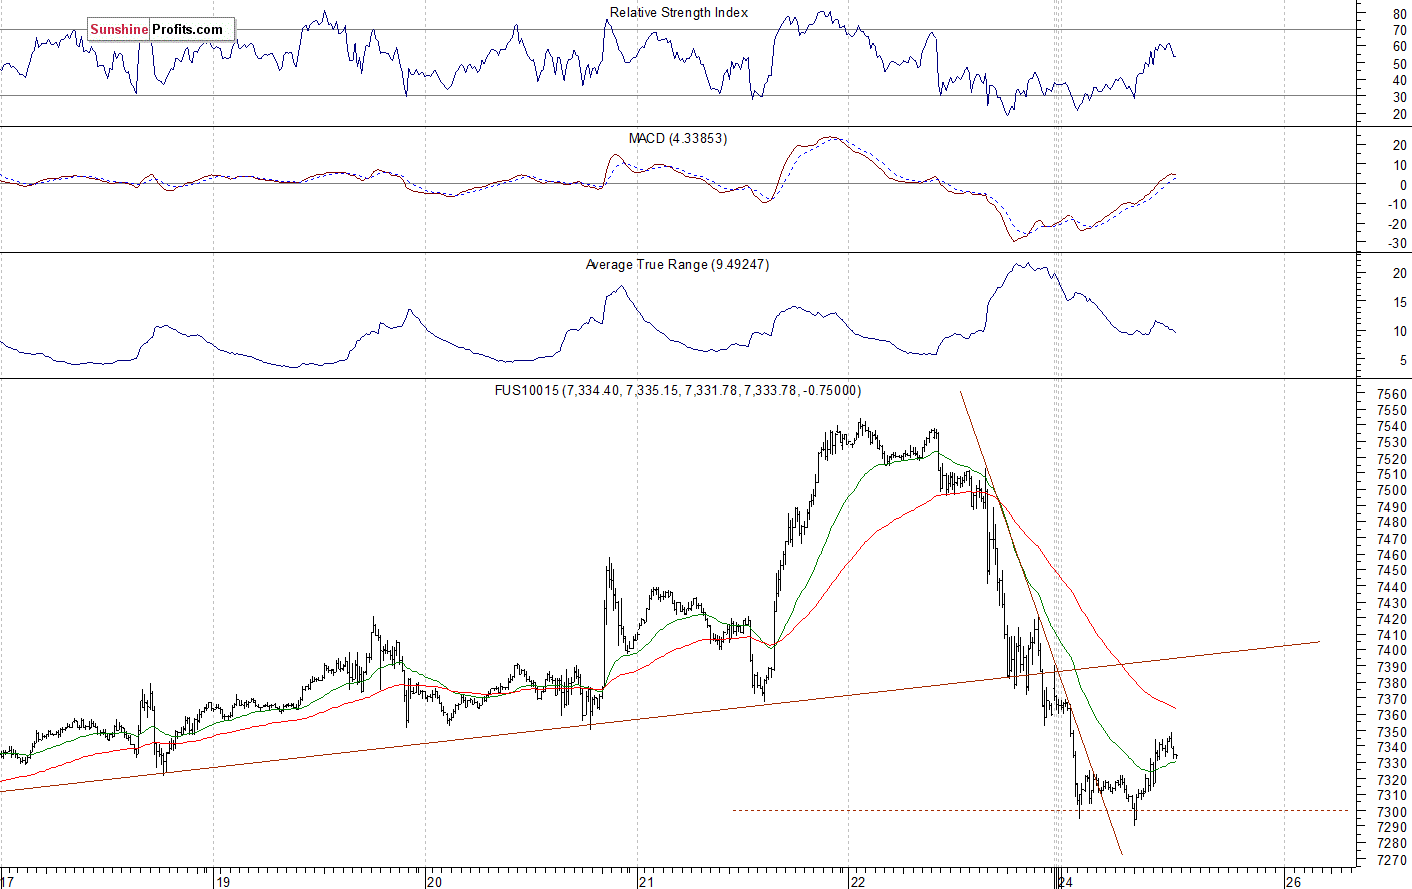
Nasdaq Also Slightly Bouncing
The technology Nasdaq 100 futures contract follows a similar path, as it trades within an intraday uptrend after an overnight decline. The market rallied more than 1,700 points from December the 26th local low of around 5,820. But then it fell more than 250 points from its Thursday's overnight local high. The nearest important resistance level is now at 7,400-7,450. On the other hand, the support level is at 7,200-7,250, among others. The Nasdaq futures contract bounced off the 7,300 mark this morning, as the 15-minute chart shows:
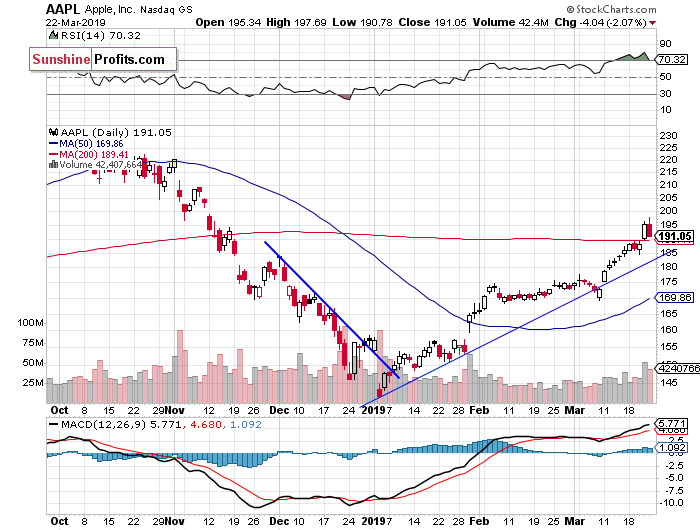
Big Cap Tech Stocks - Downward Reversal?
Let's take a look at the Apple, Inc. stock (AAPL) daily chart (chart courtesy of StockCharts). The market broke above its recent local highs a week ago and then it continued above the $180 level. On Thursday and on Friday the stock accelerated the uptrend and it traded within a resistance level of $190-200. But then it reversed its upward course. We could see some more selling following bouncing off the mentioned resistance level:
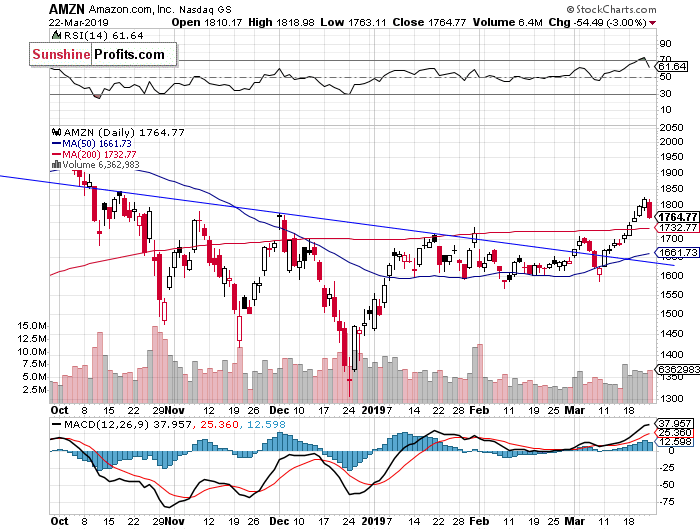
Now let's take a look at the daily chart of Amazon.com, Inc. (AMZN). The price broke above the previous local high early last week and on Thursday it broke above the $1,800 level. However, Friday's trading session was bearish as the stock bounced off the resistance level:
Blue Chip Stocks Remain Relatively Weak
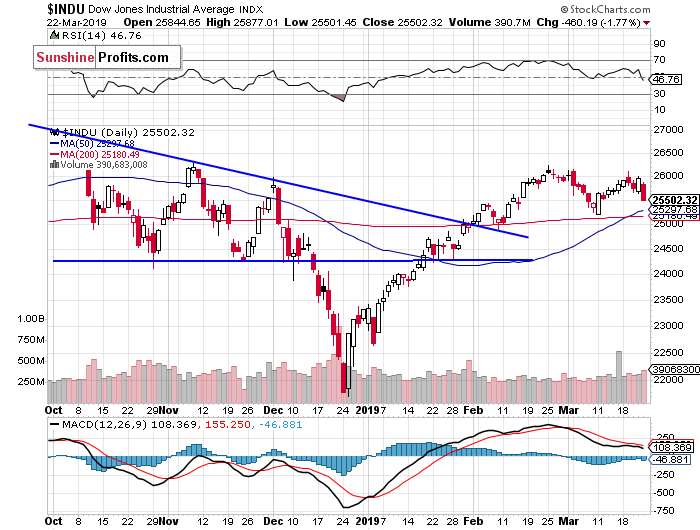
The Dow Jones Industrial Average retraced some more of its early March decline last week, but on Friday it reversed lower. The resistance level remains at around 26,000. And the blue-chip stocks gauge continues to trade below the February local high:
Nikkei Selling Off
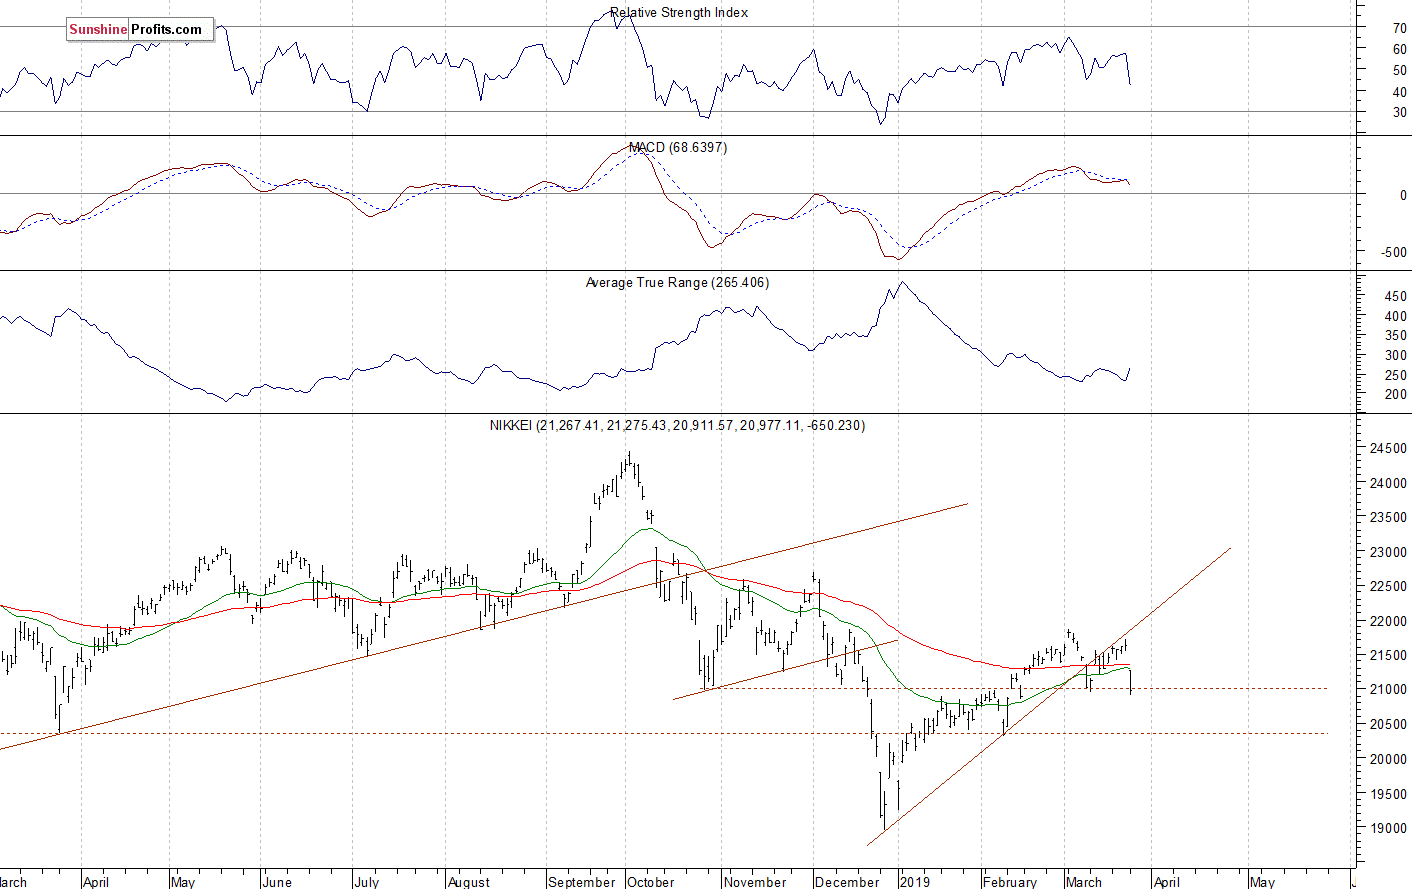
Let's take a look at the Japanese Nikkei 225 index. It accelerated the downtrend in late December, as it fell slightly below the 19,000 level. Since then it has been retracing the downtrend. Recently the market broke above its local highs and the 21,000 resistance level. But then it bounced off the resistance level of around 22,000 and retraced most of the recent advance. Today it sold off again, as it got back to the 21,000 mark. The picture looks quite bearish:
The S&P 500 index extended its short-term uptrend last week, as it got the highest since October the 10th again. Then the market bounced off the previously broken two-month-long upward trend line and it fell almost 2% on Friday. So will it continue lower? For now, it looks like a downward correction within a three-month-long uptrend.
Concluding, the S&P 500 index will likely open slower today. Then we may see some short-term uncertainty following last week's Thursday's rally and the Friday's sell-off.
Disclosure: None.


