
Friday’s Decline May Be Retraced, But Will S&P 500 Get Back Above 4,500?
On Friday stocks were the lowest since the end of August. We may see a rebound today, but is the market poised to go even lower then?
The broad stock market index lost 0.77% on Friday after falling almost 0.5% on Thursday. It went much below the 4,500 level. On September 2 the index reached a new record high of 4,545.85. Since then it has lost almost 90 points (around 2%). This morning stocks are expected to open higher and retrace some of the recent decline.
The index remains elevated after the recent run-up, so we may see some more profound profit-taking action at some point.
The nearest important support level of the broad stock market index is at 4,465-4,470, marked by the previous local low. The next support level is at 4,445-4,450. On the other hand, the nearest important resistance level is at 4,490-4,500, marked by the previous support level. The S&P 500 got back close to its over four-month-long upward trend line on Friday, as we can see on the daily chart (chart by courtesy of http://stockcharts.com):
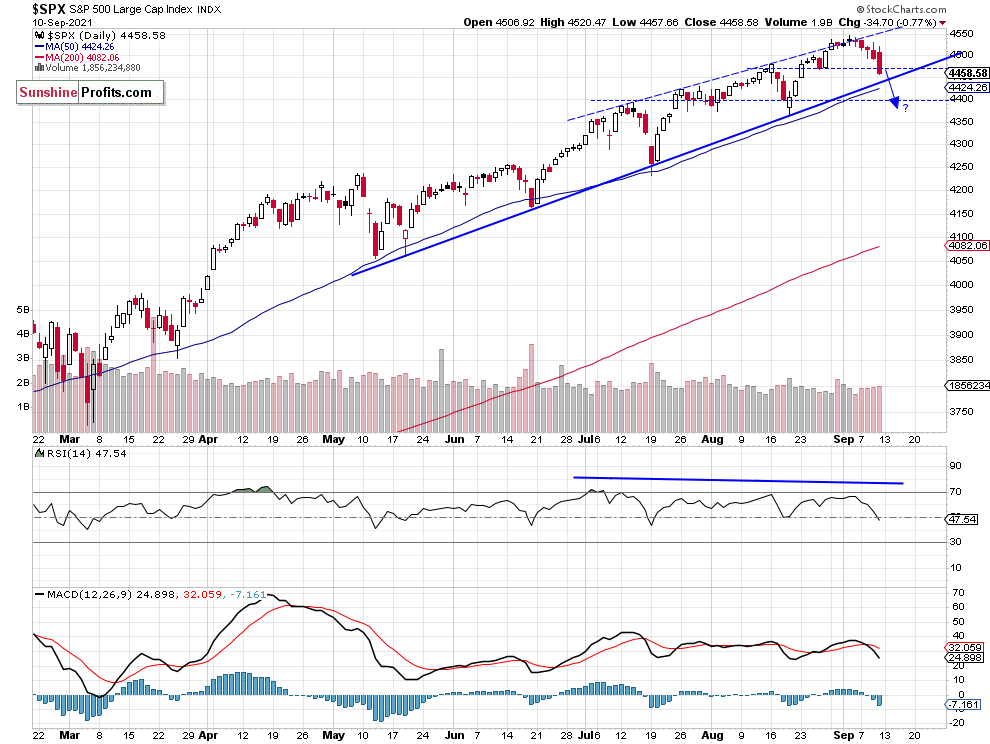
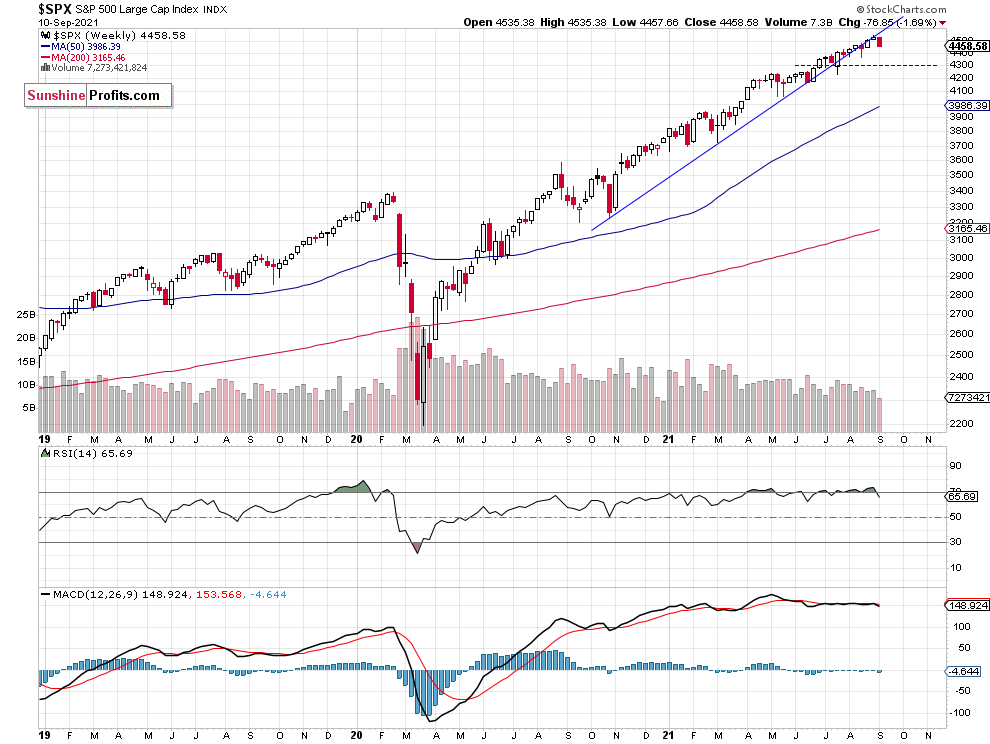
S&P 500 Remains Below Medium-Term Trend Line
The S&P 500 index broke below its medium-term upward trend line. However, it is still relatively close to that trend line. The nearest important support level is at 4,300, as we can see on the weekly chart:
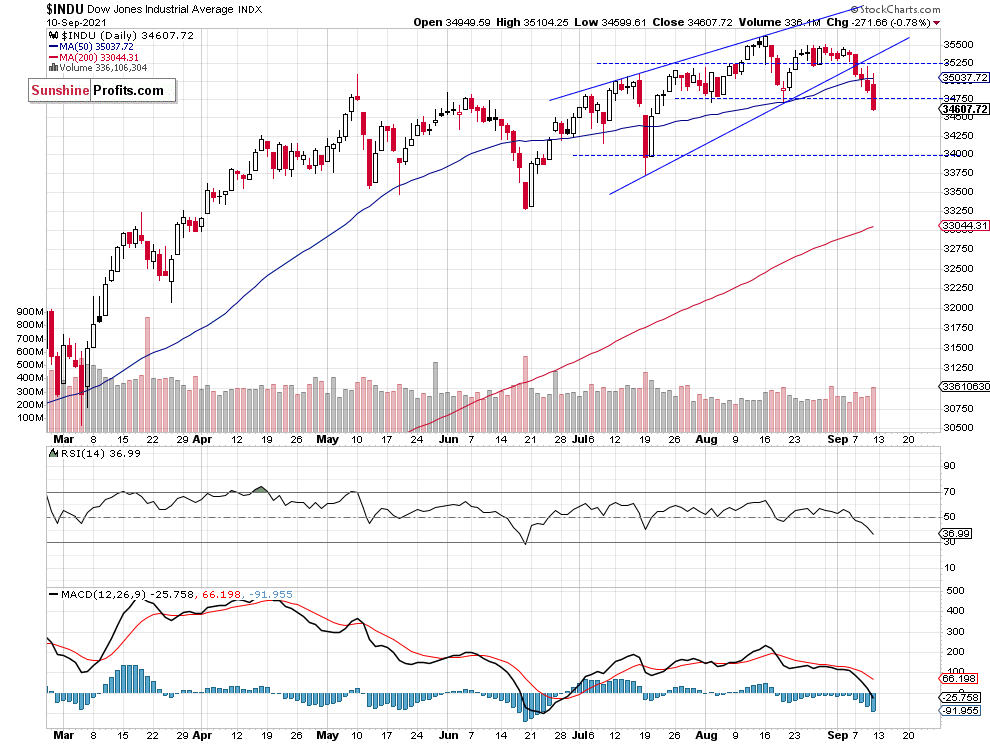
Dow Jones Went Lower – As Expected
Let’s take a look at the Dow Jones Industrial Average chart. The blue-chip index broke below a potential two-month-long rising wedge downward reversal pattern last week. It remained relatively weaker, as it didn’t reach a new record high like the S&P 500 and the Nasdaq. The support level is now at around 34,500 and the near resistance level is at 34,750, marked by the recent support level, as we can see on the daily chart:
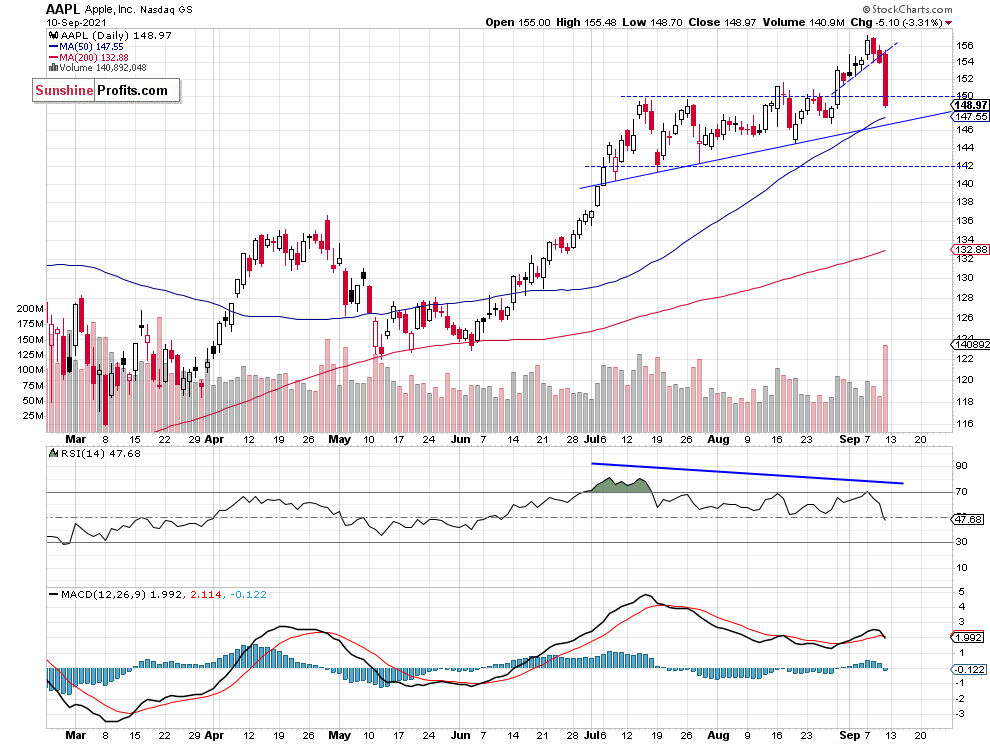
Apple’s Bull Trap
Apple stock weighs around 6.3% in the S&P 500 index, so it is important for the whole broad stock market picture. Almost a week ago on Tuesday it reached a new record high of $157.26. Since then it has been declining. So it looks like a bull trap trading action. On Friday the stock accelerated its downtrend following an unfavorable federal judge's ruling. We can still see negative technical divergences between the price and indicators and a potential topping pattern. The two-month-long upward trend line remains at around $145.0-147.5.
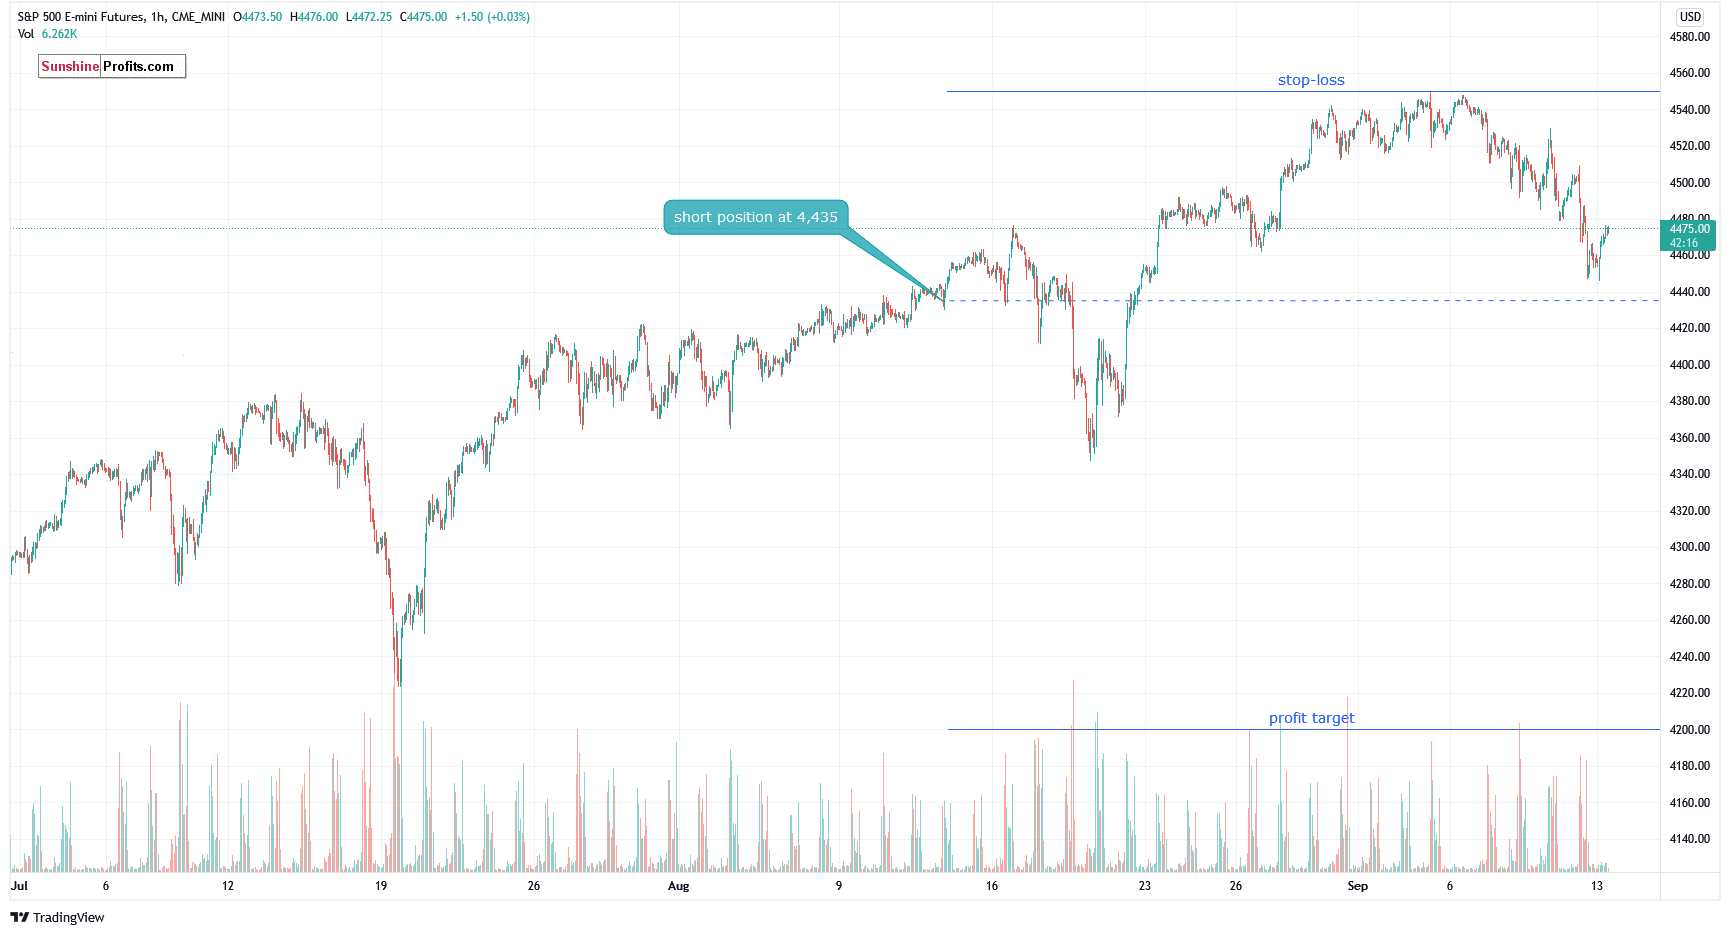
Our Short Position – Closer to Break-Even Point
Let’s take a look at the hourly chart of the S&P 500 futures contract. We opened a short position on August 12 at the level of 4,435. The position was profitable before the recent run-up. We still think that a speculative short position is justified from the risk/reward perspective. (chart by courtesy of http://tradingview.com):
Conclusion
On Friday, the S&P 500 index accelerated its short-term downtrend after breaking below 4,500 level again. For now, it still looks like a correction within an uptrend. Today we will most likely see a higher opening of the trading session – we may see another profit-taking action later in the day though.
The market seems short-term overbought, and we may see some downward correction soon. Therefore, we think that the short position is justified from the risk/reward perspective.
Here’s the breakdown:
- The market retraced more of its recent advances on Friday, as the S&P 500 index extended its decline below 4,500 level.
- Our speculative short position is still justified from the risk/reward perspective.
- We are expecting a 5% or bigger correction from the record high.
Disclaimer: All essays, research, and information found above represent analyses and opinions of Paul Rejczak and Sunshine Profits' associates only. As such, it may prove wrong and be a ...
more

