
Forex Volatility Shot To Pieces, CAD Outperforms
With volatility shot to pieces, the consolation we have as Forex traders is that it's only going to get better this Tuesday, following the snooze fest in currencies as the US markets went for a long weekend in commemoration of Martin Luther King Day. Even if volatility is non-existent, have you analyzed what pairs show the clearest trend in the bigger timeframes? If not, today's report will dissect this information for you. Let's find out...
Quick Take
If it wasn’t enough with volatility shot to pieces in recent times, Forex traders had to navigate even calmer waters though Monday as the US markets (cash equities and bonds) were closed in commemoration of Martin Luther King Day. The Canadian Dollar attracted the most buy-side interest, followed by the US Dollar, in line with the slow money directional bias through this month of January. The Pound gave us some brief spell of volatility through the European morning hours, but the momentum never picked up further steam and the market ended rotating back up recouping all the losses. The Euro, the Yen or the Swissy were a snooze fest, with no action of note ahead of today’s BoJ policy meeting and Thursday’s ECB. Meanwhile, the Oceanic complex (AUD, NZD) moved in lockstep towards the downside, ending as the worst performing currencies.
(Click on image to enlarge)

Narratives In Financial Markets
* The Information is gathered after scanning top publications including the FT, WSJ, Reuters, Bloomberg, ForexLive, Institutional Bank Research reports.
Forex trading quiet as US markets on holidays: The currency market behaved very quietly in line with the depressed vol levels, even if this time, it got even worse as the US markets were closed on Monday for Martin Luther King day. Anyway you slice it, the Forex market is going through the most suppressed levels of vol since the early 1970s as the race to the bottom in interest rates by Central Banks continues.
The BoJ is scheduled for today, no changes eyed: The BOJ policy statement is due this Tuesday. As it’s been the case for some time, the expectations for any change in policy are very low, with a snooze fest eyed. At this point, the BoJ may still want to sit out this one to assess the impact of the extra fiscal stimulus by the Japanese government in order to offset sales tax hike from October last year. The BOJ statement is released between 02:30 and 03:30GMT, with Kuroda's press conference due at 06:30GMT.
BoC, ECB are next in line: The Bank of Canada will follow with its announcement on policy on Wednesday, while the European Central Bank will be the last to release its decision on Thursday. The number one thematic these Central Bank are likely to emphasize is the tentative evidence of a more stable global environment, with the US-China trade deal likely to anchor these views. Even the ECB, in its last minutes last week, mentioned that there are early signs of a slight pick up in inflation and growth potentially bottoming out in countries like Germany.
IMF more optimistic on manufacturing and global trade: In its annual world economic outlook report, the IMF trimmed 2020 global growth forecast to 3.3% from 3.4% previously due to a slight downward revision to a sharper-than-expected slowdown in India. However, what really matters, in line with the above thematic Central Banks are likely to focus on, the IMF notes that it sees tentative signs that manufacturing and global trade are bottoming out partially due to the US-China trade deal. The IMF sees risks less tilted to the downside than in October, even if it warns that the US-Iran tensions, social unrest and a flare-up in trade tensions are key concerns. The China 2020 growth forecast was upgraded by 0.2 bp, now seen at 6.0% (5.8% previously) while the Euro area 2020 growth forecast is seen at 1.3% (1.4% previously). The UK 2020 growth forecast is seen at 1.4% (unchanged).
Economic impact of the Australian bushfires uncertain: According to the Australian Treasurer Frydenberg, the full economic impact of the bushfires remains uncertain. In the short-term in may take its toll on businesses confidence and consumption, which may keep the RBA on guard. However, as a caveat, with housing and construction activity set to increase and a pick up in inflation nt to be ruled out, alongside more employment available during the recovery period, the RBA will have to manage these opposing forces. The focus by the market is whether or not the RBA ends up lowering the rates to 0.25% this year (currently at 0.75%), at which point, the talk of QE will intensify.
US and France reach a truce on trade tariffs: The leaders of France and the US, Macron and Trump, spoke on the phone on Sunday, in a conversation that led to an agreement to a truce on tariffs until the end of the year. A French diplomat commented on that call saying that the leaders also agreed to pursue talks on the digital tax proposed by France until the end of the year. The news is a positive input for risk flows once the markets reopen in the US. Macron tweeted that “we will continue to work together with Trump on a good agreement to avoid tariff escalation.” The US had threatened to apply tariffs on $2.4bn of French goods as a retaliation for France aiming to collect a digital tax on US companies such as Amazon or Apple. The truce suspends this until the end of the year.
Oil shrugs off the Libyan conflict: The rival government in Libya shut down half of the oil exports (about 800,000 barrels/day of supply out of circulation). However, there are reports suggesting that the impasse may be resolved sooner than expected as rival forces are already under negotiations to lift the restrictions imposed by the Libyan commander of the rival government Khalifa Haftar. There was an immediate adjustment in the price of Oil as the blockage represented a deficit of near 1% of the world production, but that has now been priced out.
Recent Economic Indicators & Events Ahead

Source: Forexfactory
Insights Into FX Index Charts
Note 1: The outlook for the G8 FX space has not varied in the slightest given the quiet nature of the Forex market during the long weekend in the US to commemorate Martin Luther King day. There is no point in simply re-wording it to express the exact same ideas. Therefore, Monday’s analysis still remains as relevant today when markets return to business as usual as it was yesterday. What I’ve done is to update the charts to reflect a new candle in the daily timeframe.
Note 2: I’ve introduced at the bottom, what in my opinion are some of the hottest markets to look to engage with a well defined directional bias in the coming week. Check them out.
The EUR index poked into a higher level of liquidity before reversing its course of action back to the downside, reaffirming the range-bound nature of the market. This consolidation profile must be taken as part of the context of a macro bearish trend as per the weekly market structure. As pointed out last week, the rise in the index was never accompanied by a bullish slope in the compounded tick volume via the 13ma applied to the OBV, showing dubious commitment by buy-side accounts, and by now confirmed that the intention was to collect EUR short inventory at more attractive prices before the release of the sell-side pressure kicked in. The volatility in the EUR-pair, a recurring theme across FX, remains very depressed. No changes there. The rise in the EUR last week was also challenged by January’s seasonal pattern, negative for the EUR.
(Click on image to enlarge)

The GBP index failed to sustain any upside momentum after the catastrophic UK retail sales reading, which brings to the forefront the prospects of an immediate rate cut by the BoE. In the last few weeks, the price action in the index portrays a market confined in a range below a critical pivot level of resistance that has been respected for a couple of times. Despite fundamentals for the GBP have started in an appalling way this 2020, the daily price action is yet to confirm a breakout. What we are seeing so far is the Pound holding extraordinarily well judging by the plethora of negative news is receiving amid a stand-by in Brexit headlines. The price action candle from last Friday is bearish and puts the recent lows at risk. The volatility in the GBP, as in the case of the rest of G8 FX, remains suppressed below the monthly average.
(Click on image to enlarge)

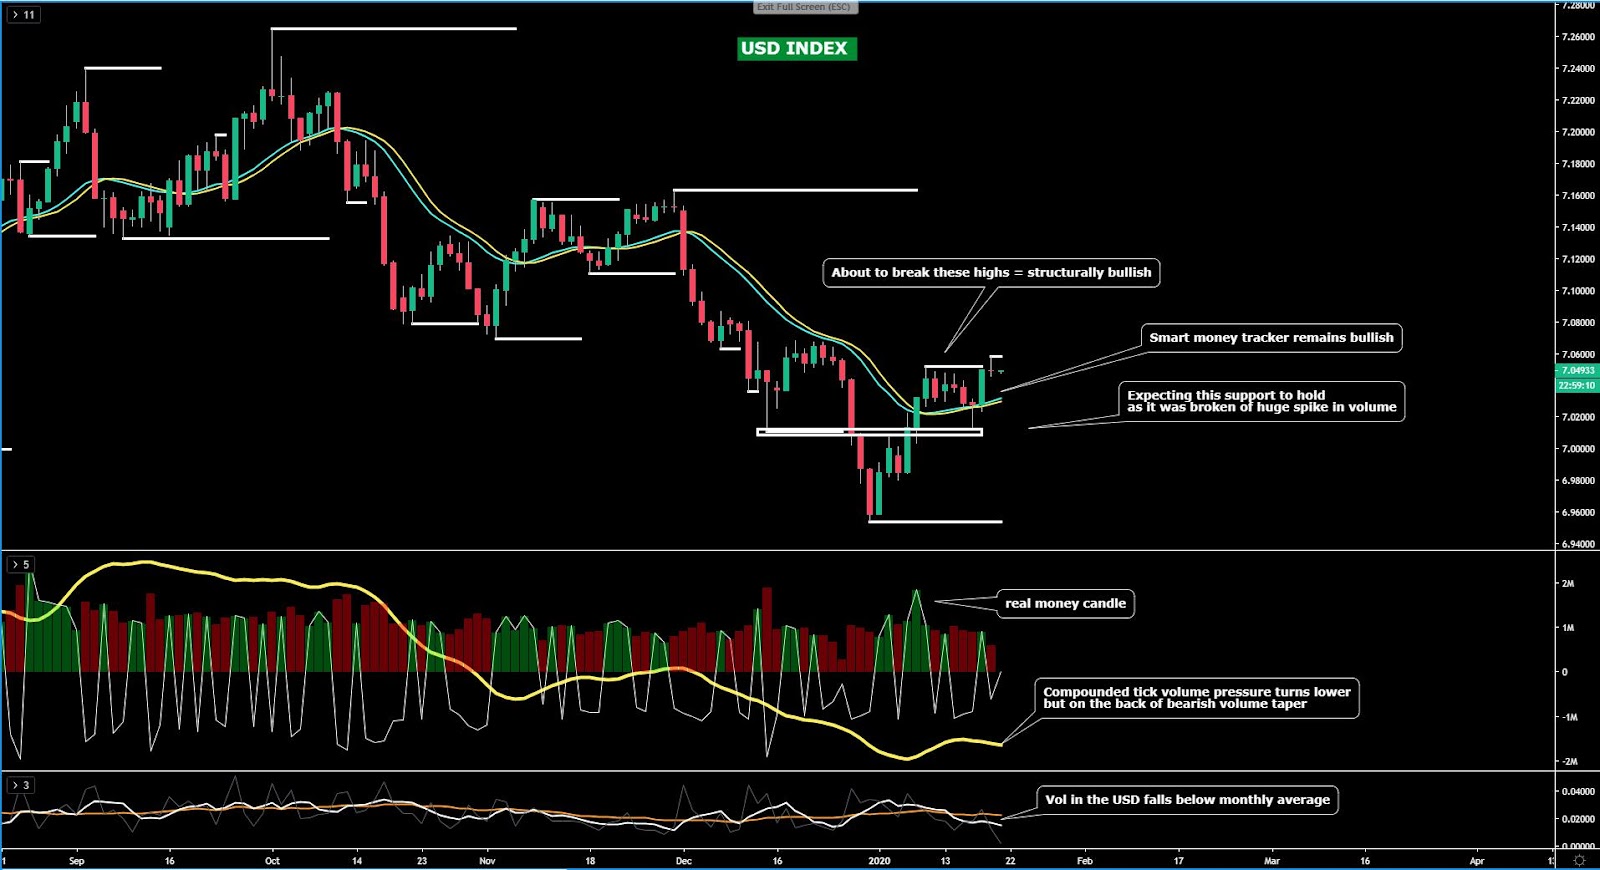
The USD index is just a whisker away from confirming the first breakout of structure on the daily that would formalize the bullish outlook even if the bias I’ve subscribed to since the beginning of the year has been one of optimism for rises to materialize as elaborated in this report daily. The breakout higher may come any hour, and with it, it would tick all the boxes one can think of to shift the focus to fully and unambiguously bullish on the USD. We’d then be able to align the smart money tracker (enhanced moving averages) pointing up, the structure of price confirming the bullish flows, the volume pressure ditto, and USD seasonals also in favor. Full circle for bulls.
(Click on image to enlarge)
The CAD index continues to play out the script that I had envisioned and telegraphed through my daily report. Whenever you see my chart annotations barely modified, that’s a good sign, as it means the scenarios have or are panning out as I would have anticipated based on the analysis performed. To me, the CAD is a market that one must approach from building long inventory on weakness, and as a reference where to consider a plan of engagement, I’ve endorsed to be a buyer between the 38.2% to 50% fibonacci retracement at the index. Last week, we saw the dips being bought up the moment the former fib was tested and the price never looked back. All the stars are aligning, especially after Friday’s bullish engulfing price action to see new highs created. The seasonals for the CAD are positive in January too, as in the case of the USD.
(Click on image to enlarge)

The JPY index is without a doubt the most bearish currency and with the risk flows so firmly bullish as per the record highs in the S&P 500 as the bellwether, it’s hard to make a case for an adoption of a long bias in the currency except if spells of risk-off episodes hit the currency or sellers ponder the idea of taking profits more aggressively. All the technical elements keep the bearish bias intact, with the price structure bearish and the risk sentiment adding pressure to the Yen, alongside the compounded tick volume slope (13ema to OBV) pointing bearish. However, and I reiterate, the only ‘but’ is that the tapering of tick volume on the way down is not a good sign, as neither it is that this is happening at a macro support. This is my only concern, as if the currency is to find legs to the upside, this would be the ideal location to engineer a buy-side campaign as the price is definitely very cheap by historical standards.
(Click on image to enlarge)

The AUD index, as in the case of the CAD, I have no much else to add, since the market continues to play out in the way I envisioned. That is, the rise of the currency run out of steam at the intersection of the midpoint of its macro range, a juncture that has proven to be a tough nut to crack for the Aussie ever since the formation of this range occurred back in Sept last year. Therefore, until violated to the upside, any objective technical call in the Aussie cannot be justified as placing too much optimism on the prospects for the currency. At best, I’d personally retain a neutral to bearish bias with a steadier outlook unfounded at this point. As a positive note for the Aussie though, the last 4 days of falls have carried a taper of volume. The seasonals are positive to the tune of +0.54% in Jan since the early 1980s for the Aussie though.
(Click on image to enlarge)

The NZD index, and at the risk of sounding like a broken record, does not show any significant action that would make me change in any way, shape or form my neutral to bullish outlook. Why this stance? Because I consider this to be a market established in a short-term range in the broader context of a bullish trend. Therefore, under this structural profile, buying weakness at support levels has definitely paid good dividends so far. Remember, in ranges, the signals can be more conflicting, so I wouldn’t add that much weight to the positioning of the compounded tick volume pressure as assessed by the 13ma off the OBV nor the enhanced moving averages tracking the smart money flows. As in the case of the EUR or GBP, the NZD also shows a range as the most accurate profile at play, with the advantage of being formed on the back of macro bull flows. The volatility to be trading NZD pairs has fallen below the usual monthly average.
(Click on image to enlarge)

The CHF index, on the back of reaching its 100% proj target, continues to find it a struggle to keep attracting further buy-side flows as one would anticipate at this symmetrical location. Despite the measured move is now complete, it remains very premature to call this the ultimate top as the fast money will probably not give up that easily in a currency that has put on a spectacular rally, which is even more meritorious, judging by the absurd low volatility elsewhere, and that half the other G8 FX currencies are trapped in ranges (EUR, GBP, NZD, AUD). If my view is any indication to go by, I’ve subscribed to the idea that this market has been driven by fast money scalping or short-term intraday trend trading strategies. Once we step out of the smaller time frames, this market is out of whack and with the positive swap offered to short CHF, these levels are incredibly interesting for the patient traders.
(Click on image to enlarge)

What Pairs Are Trending In FX?
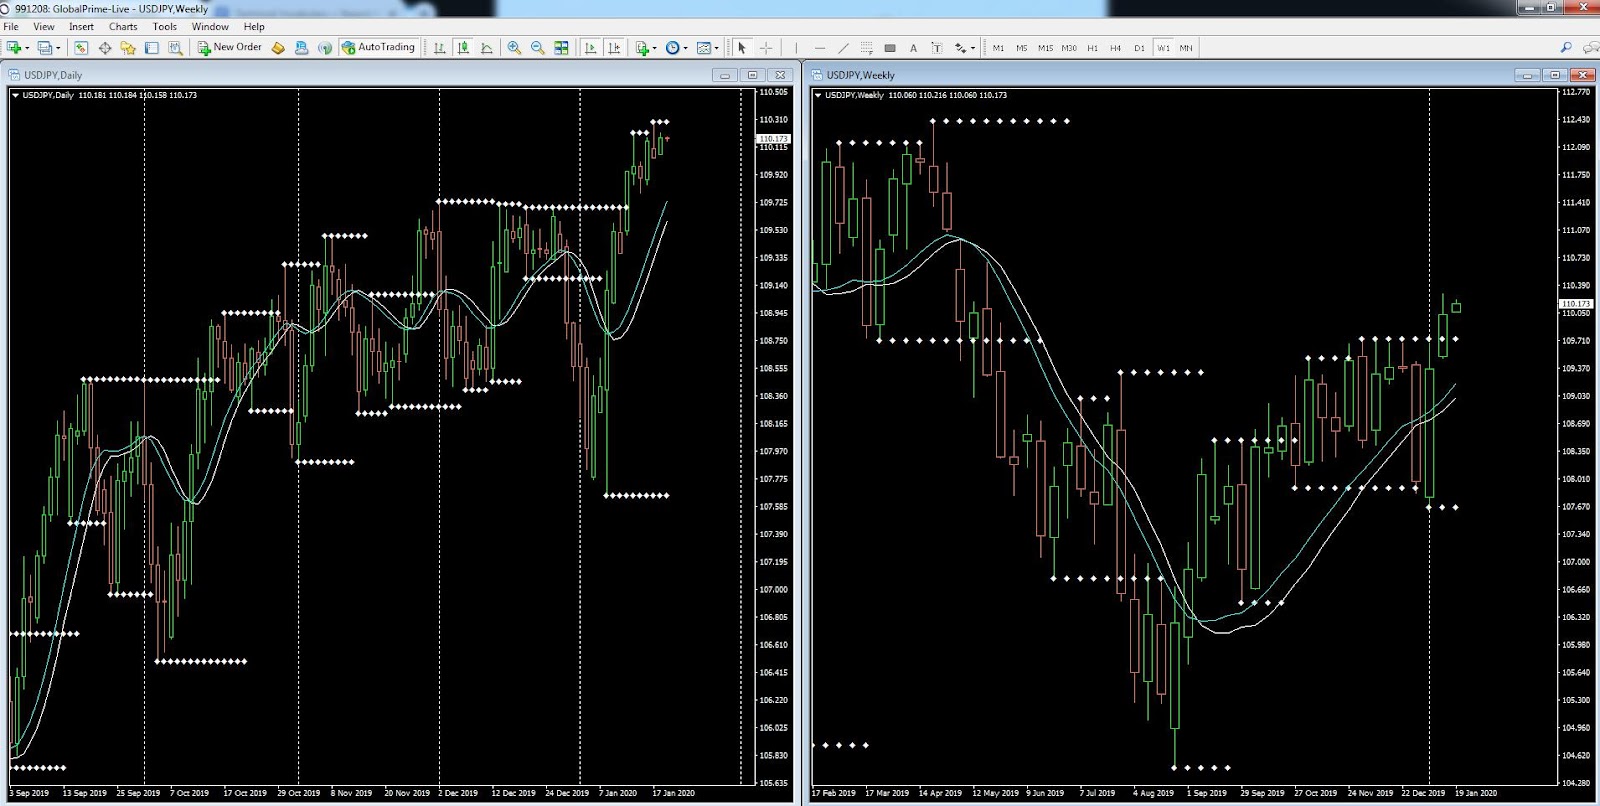
Note 1: These markets are best suited for trend trading strategies or those, like me, that look to capitalize in one of my accounts a directional bias prior to grabs of liquidity.
Respecting the order below, the first pair starting from the top includes the USD/JPY. This is the only major market in my radar this week for potential long opportunities. The weekly and the daily are in alignment, both showing uptrends in the respective timeframes. Next up is the AUD/CHF, having recently broken its price structure lower in the daily and weekly. The CAD/JPY, which displays a very similar picture to USD/JPY, but even cleaner in terms of price action, is another market to ponder longs if lower grabs of liquidity materialize. The EUR/CHF is another market that has been trending really nicely and should be on one’s watch list for a potential continuation of the downtrend (don’t forget we have the ECB this week). In contrast, I am looking to go long the EUR market against the JPY if a setup occurs and the timing of it does not interfere with the release of the ECB policy. A setup long on the aftermath of the ECB outcome would be ideal (waiting for market to grab lower liquidity). GBP/CHF is another market that I am firmly bearish until a macro support (yellow line) is tested.
(Click on image to enlarge)
(Click on image to enlarge)

(Click on image to enlarge)

(Click on image to enlarge)

(Click on image to enlarge)

(Click on image to enlarge)

Important Footnotes
Cycles: Markets evolve in cycles followed by a period of distribution and/or accumulation. To understand the principles applied in the assessment of cycles, refer to the tutorial How To Read Market Structures In Forex
Horizontal Support/Resistance: Unlike levels of dynamic support or resistance or more subjective measurements such as fibonacci retracements, pivot points, trendlines, or other forms of reactive areas, the horizontal lines of support and resistance are universal concepts used by the majority of market participants. It, therefore, makes the areas the most widely followed and relevant to monitor. The Ultimate Guide To Identify Areas Of High Interest In Any Market
Trendlines: Besides the horizontal lines, trendlines are helpful as a visual representation of the trend. The trendlines are drawn respecting a series of rules that determine the validation of a new cycle being created. Therefore, these trendline drawn in the chart hinge to a certain interpretation of market structures.
Fundamentals: It’s important to highlight that the daily market outlook provided in this report is subject to the impact of the fundamental news. Any unexpected news may cause the price to behave erratically in the short term.
Projection Targets: The usefulness of the 100% projection resides in the symmetry and harmonic relationships of market cycles. By drawing a 100% projection, you can anticipate the area in the chart where some type of pause and potential reversals in price is likely to occur, due to 1. The side in control of the cycle takes profits 2. Counter-trend positions are added by contrarian players 3. These are price points where limit orders are set by market-makers. You can find out more by reading the tutorial on The Magical 100% Fibonacci Projection
The Daily Edge is authored by Ivan Delgado, Head of Market Research at Global Prime. The purpose of this content is to provide an assessment of the market conditions. The report takes an in-depth ...
more

